


Legenda tim InstaSpot!
Legenda! Anda pikir legenda adalah retorika yang bombastis? Lalu, bagaimana menyebut seorang pria, seorang Asia pertama yang memenangkan kejuaraan catur dunia junior pada usia 18 tahun, dan yang menjadi Grandmaster India pertama pada usia 19 tahun? Itulah awal perjalanan yang sulit dalam meraih gelar Juara Dunia bagi Viswanathan Anand, pria yang menjadi bagian dari sejarah catur untuk selamanya. Sekarang, satu lagi legenda masuk ke dalam tim InstaSpot!


Borussia merupakan salah satu klub sepakbola paling terkenal di Jerman, yang telah berulang kali membuktikan pada para penggemarnya: semangat kompetisi dan kepemimpinan pasti akan mengarah pada kesuksesan. Lakukan trading dengan cara yang sama seperti para profesional olahraga: percaya diri dan aktif. Gunakan "kunci" dari Borussia FC dan jadilah yang terdepan bersama InstaSpot!

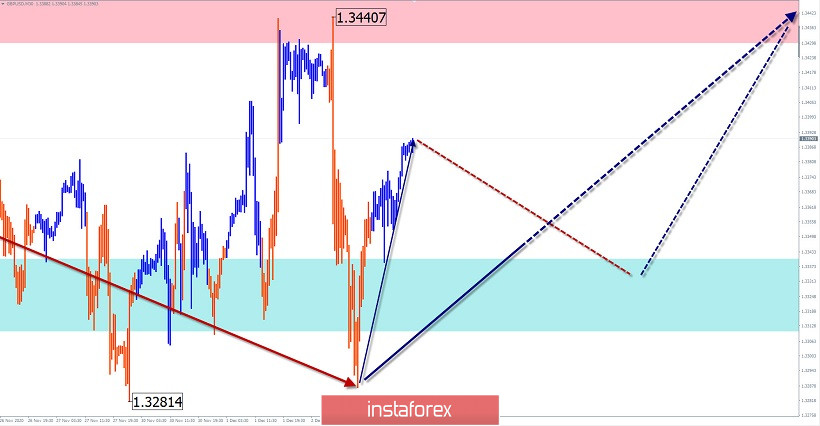
GBP/USD
Analysis:
An upward wave has been developing on the chart of the British pound since mid-October. The unfinished section has been reporting since November 2. It completed the oncoming correctional movement in the form of a horizontal shifting plane. The upward section that started yesterday has a reversal potential and can be the beginning of a new wave along with the trend.
Forecast:
In the first half of the day, a flat is likely, with a descending vector. By the end of the day, you can expect activation and a price rise in the area of the calculated resistance. A further break up is not excluded today.
Potential reversal zones
Resistance:
- 1.3430/1.3460
Support:
- 1.3340/1.3310
Recommendations:
Sales on the British pound market today are very risky and are not recommended. The main attention should be paid to finding places to enter long positions.
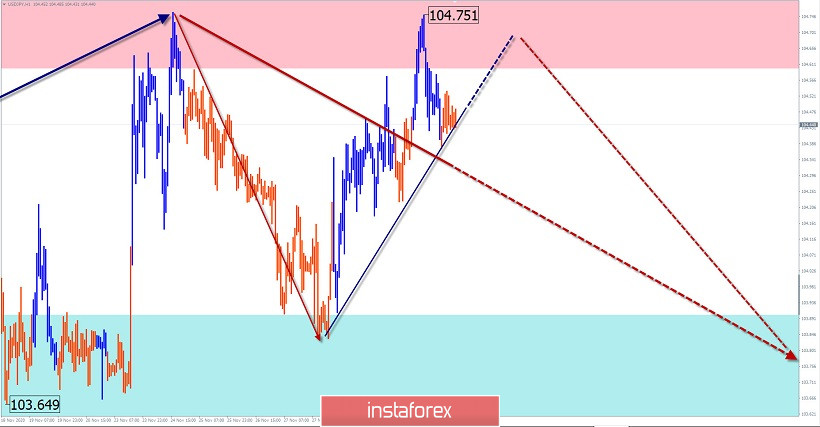
USD/JPY
Analysis:
Since November 9, a descending wave structure has been forming on the Japanese yen chart. Its structure lacks the final section. At the time of analysis, the price is at the lower limit of the resistance zone of a large time frame.
Forecast:
In the next 24 hours, the pair's market will end its upward movement. Then you can wait for a reversal and the beginning of an intensive decline. Calculated support shows the lower limit of the expected range of the daily move.
Potential reversal zones
Resistance:
- 104.60/104.90
Support:
- 103.90/103.60
Recommendations:
There are no conditions for buying the Japanese yen today. In the area of the calculated resistance, it is recommended to track all emerging signals for selling the instrument.
Explanation: In the simplified wave analysis (UVA), waves consist of 3 parts (A-B-C). The last incomplete wave is analyzed. The solid background of the arrows shows the formed structure, and the dotted background shows the expected movements.
Note: The wave algorithm does not take into account the duration of the instrument's movements in time!
*Analisis pasar yang diposting disini dimaksudkan untuk meningkatkan pengetahuan Anda namun tidak untuk memberi instruksi trading.
Tinjauan analitis InstaSpot akan membuat Anda menyadari sepenuhnya tren pasar! Sebagai klien InstaSpot, Anda dilengkapi dengan sejumlah besar layanan gratis untuk trading yang efisien.
Your IP address shows that you are currently located in the USA. If you are a resident of the United States, you are prohibited from using the services of InstaFintech Group including online trading, online transfers, deposit/withdrawal of funds, etc.
If you think you are seeing this message by mistake and your location is not the US, kindly proceed to the website. Otherwise, you must leave the website in order to comply with government restrictions.
Why does your IP address show your location as the USA?
Please confirm whether you are a US resident or not by clicking the relevant button below. If you choose the wrong option, being a US resident, you will not be able to open an account with InstaSpot anyway.
We are sorry for any inconvenience caused by this message.


