


Pola sebenarnya

Bullish Symmetrical Triangle
was formed on 19.03 at 18:02:02 (UTC+0)
signal strength 3 of 5
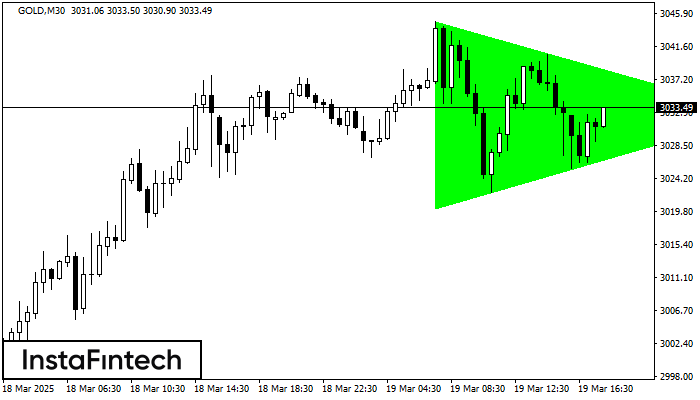
According to the chart of M30, GOLD formed the Bullish Symmetrical Triangle pattern, which signals the trend will continue. Description. The upper border of the pattern touches the coordinates 3044.87/3032.56 whereas the lower border goes across 3020.18/3032.56. The pattern width is measured on the chart at 2469 pips. If the Bullish Symmetrical Triangle pattern is in progress during the upward trend, this indicates the current trend will go on. In case 3032.56 is broken, the price could continue its move toward 3032.86.
Lihat juga
- All
- All
- Bullish Rectangle
- Bullish Symmetrical Triangle
- Bullish Symmetrical Triangle
- Double Bottom
- Double Top
- Double Top
- Triple Top
- Triple Top
- Triple Top
- Triple Top
- All
- All
- Buy
- Sale
- All
- 1
- 2
- 3
- 4
- 5
Bearish Symmetrical Triangle
was formed on 07.04 at 02:45:25 (UTC+0)
signal strength 1 of 5
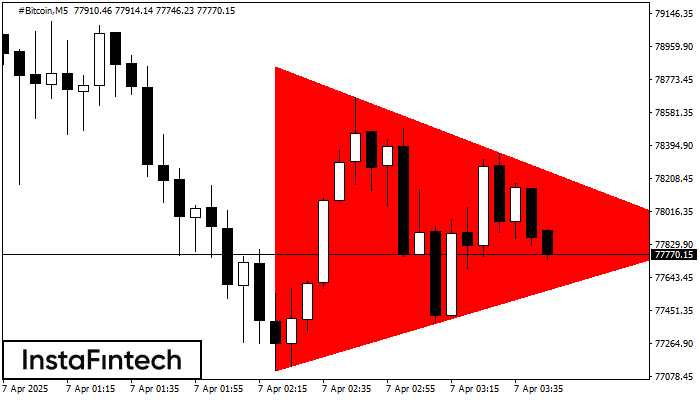
According to the chart of M5, #Bitcoin formed the Bearish Symmetrical Triangle pattern. Trading recommendations: A breach of the lower border 77111.27 is likely to encourage a continuation
The M5 and M15 time frames may have more false entry points.
Open chart in a new window
Triple Bottom
was formed on 07.04 at 02:30:15 (UTC+0)
signal strength 1 of 5
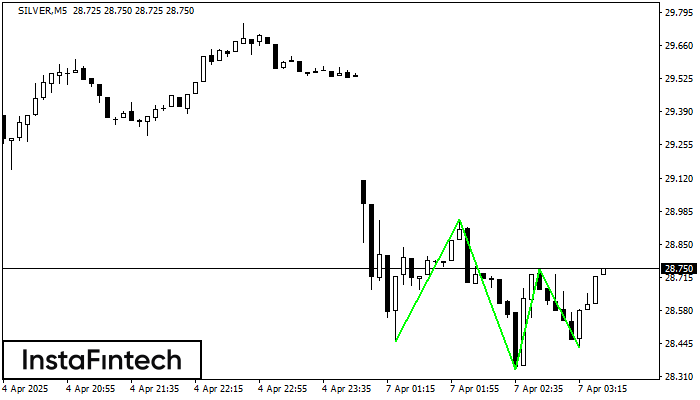
The Triple Bottom pattern has formed on the chart of SILVER M5. Features of the pattern: The lower line of the pattern has coordinates 28.95 with the upper limit 28.95/28.75
The M5 and M15 time frames may have more false entry points.
Open chart in a new window
Double Top
was formed on 07.04 at 02:30:10 (UTC+0)
signal strength 1 of 5
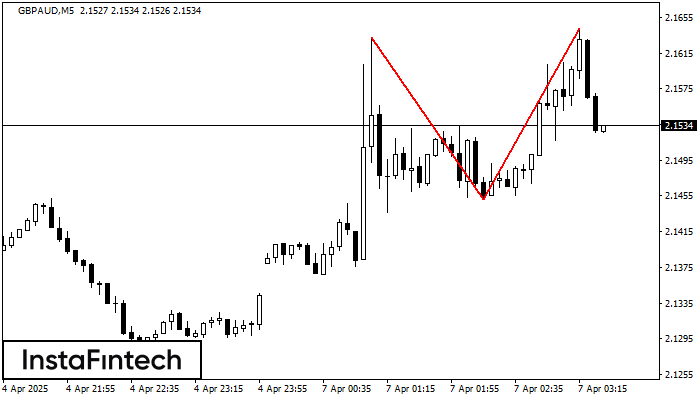
On the chart of GBPAUD M5 the Double Top reversal pattern has been formed. Characteristics: the upper boundary 2.1642; the lower boundary 2.1451; the width of the pattern 191 points
The M5 and M15 time frames may have more false entry points.
Open chart in a new window


