


हमारी टीम के पास 7,000,000 से अधिक ट्रेडर हैं!
प्रतिदिन हम ट्रेडिंग को बेहतर बनाने के लिए एक साथ काम करते हैं। हम उच्च परिणाम प्राप्त कर रहे हैं और आगे की ओर बढ़ रहे हैं।
दुनियाभर के लाखों लोगों द्वारा हमारे काम को पहचानना, हमारे काम की सबसे अच्छी सराहना है! आपने आपनी पसंद बनाई है और हम आपकी अपेक्षाओं को पूरा करने के लिए हर संभव प्रयास करेंगे!
हम एक साथ एक अच्छी टीम हैं!
इंस्टाफॉरेक्स को इस बात का गर्व है कि वह आपके लिए काम कर रहा है!


एक्टर, यूएफसी 6 टूर्नामेंट का विजेता और एक सच्चा हीरो!
वह आदमी, जिसने अपनी मेहनत से सब किया है। वह आदमी, जो हमारे रास्तों पर चलता है.
टैक्टारोव की सफलता का राज लक्ष्य की ओर लगातर अग्रसर रहना है।
अपनी प्रतिभा के सभी पक्षों को प्रकट करें!
खोज करें, कोशिश करें, विफल हो-लेकिन कभी न रूकें!
इंस्टाफॉरेक्स- हमारी सफलताओं की कहानी यहाँ से शुरू होती है!

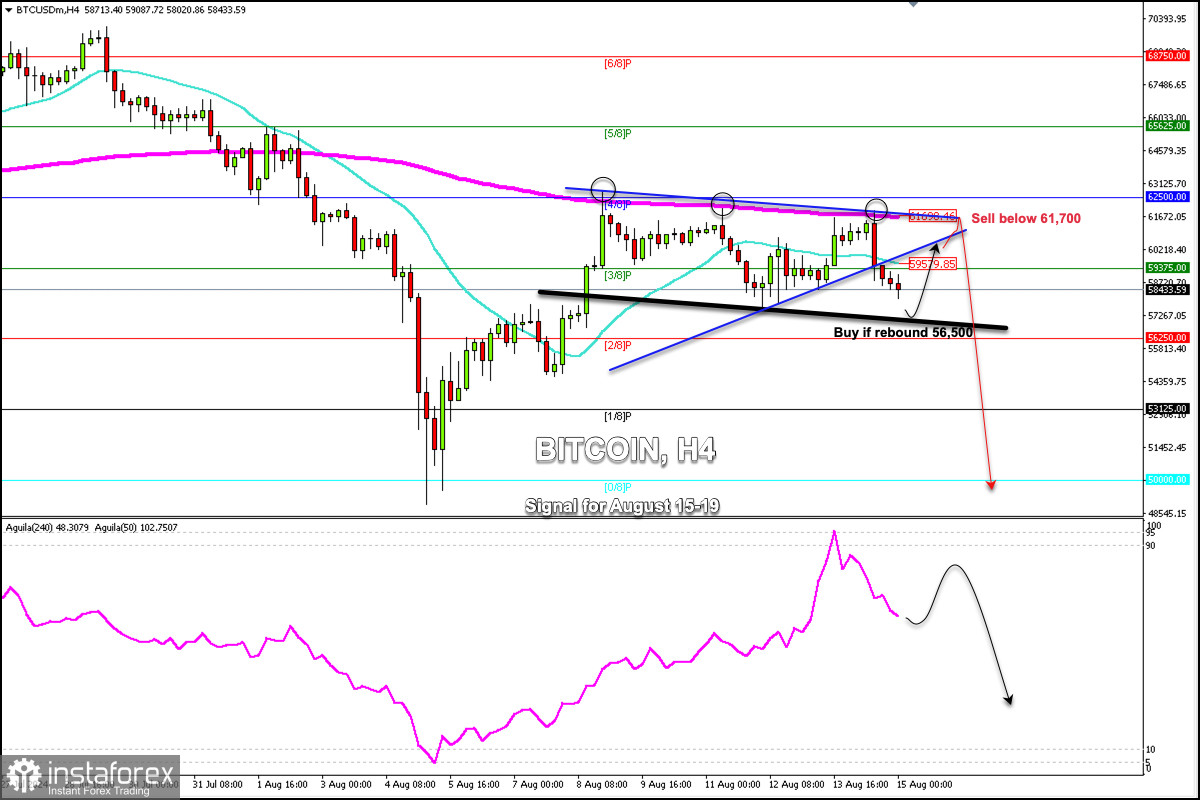
Bitcoin (BTC/USD) is trading around 58,433, below the 200 EMA, below the 21 SMA, and below the symmetrical triangle that was broken on August 14.
Since August 8th, BTC has tried several times to break the 200 EMA area and also the 4/8 Murray pivot point at about 62,500.
As Bitcoin failed to break above 62,000, we have seen that a triple-top pattern has formed. Therefore, if the Bitcoin price settles below the psychological level of $60,000 in the next few days, the crypto could reach 0/8 Murray around the psychological level of $50,000.
Yesterday, after the US inflation data, Bitcoin fell below 61,000. Since then, we have been watching a strong bearish bias. In case there is a technical rebound in the next few hours around 56,500, it will be seen as a signal to buy.
If BTC consolidates below 59,500, it could be seen as an opportunity to resume selling with targets at 56,250 and finally at 53,125.
Yesterday, the eagle indicator reached 95 points, thus showing a strong overbought market. Now, the indicator is giving a negative signal. So, we believe that as long as BTC trades below 62,500, any technical rebound will be seen as an opportunity to sell.
*यहां पर लिखा गया बाजार विश्लेषण आपकी जागरूकता बढ़ाने के लिए किया है, लेकिन व्यापार करने के लिए निर्देश देने के लिए नहीं |
InstaSpot analytical reviews will make you fully aware of market trends! Being an InstaSpot client, you are provided with a large number of free services for efficient trading.


