


हमारी टीम के पास 7,000,000 से अधिक ट्रेडर हैं!
प्रतिदिन हम ट्रेडिंग को बेहतर बनाने के लिए एक साथ काम करते हैं। हम उच्च परिणाम प्राप्त कर रहे हैं और आगे की ओर बढ़ रहे हैं।
दुनियाभर के लाखों लोगों द्वारा हमारे काम को पहचानना, हमारे काम की सबसे अच्छी सराहना है! आपने आपनी पसंद बनाई है और हम आपकी अपेक्षाओं को पूरा करने के लिए हर संभव प्रयास करेंगे!
हम एक साथ एक अच्छी टीम हैं!
इंस्टाफॉरेक्स को इस बात का गर्व है कि वह आपके लिए काम कर रहा है!


एक्टर, यूएफसी 6 टूर्नामेंट का विजेता और एक सच्चा हीरो!
वह आदमी, जिसने अपनी मेहनत से सब किया है। वह आदमी, जो हमारे रास्तों पर चलता है.
टैक्टारोव की सफलता का राज लक्ष्य की ओर लगातर अग्रसर रहना है।
अपनी प्रतिभा के सभी पक्षों को प्रकट करें!
खोज करें, कोशिश करें, विफल हो-लेकिन कभी न रूकें!
इंस्टाफॉरेक्स- हमारी सफलताओं की कहानी यहाँ से शुरू होती है!

The dollar started to lose ground near the end of Friday, and it continued to weaken with the opening of today's Asian session. In fact, the single currency moved to the upper boundary of a relatively narrow range. The main reason was the debates between Trump and Biden. By Friday evening, the overwhelming opinion that Biden had definitely lost led to countless panic-stricken news reports. Major institutional investors believe that Trump's return to the White House could turn into a disaster.
Today, the price may retreat to the lower boundary of the range. The point is that last week several representatives of the European Central Bank mentioned the possibility of two more interest rate cuts before the end of this year. This seems to have been a prelude to today's speech by Christine Lagarde. If the ECB president confirms these statements in any way, the single currency will inevitably fall. However, the euro still wouldn't be able to break out of the range. Investors are not inclined to take such big risks ahead of the release of the U.S. Department of Labor report, which is scheduled for release on Friday.
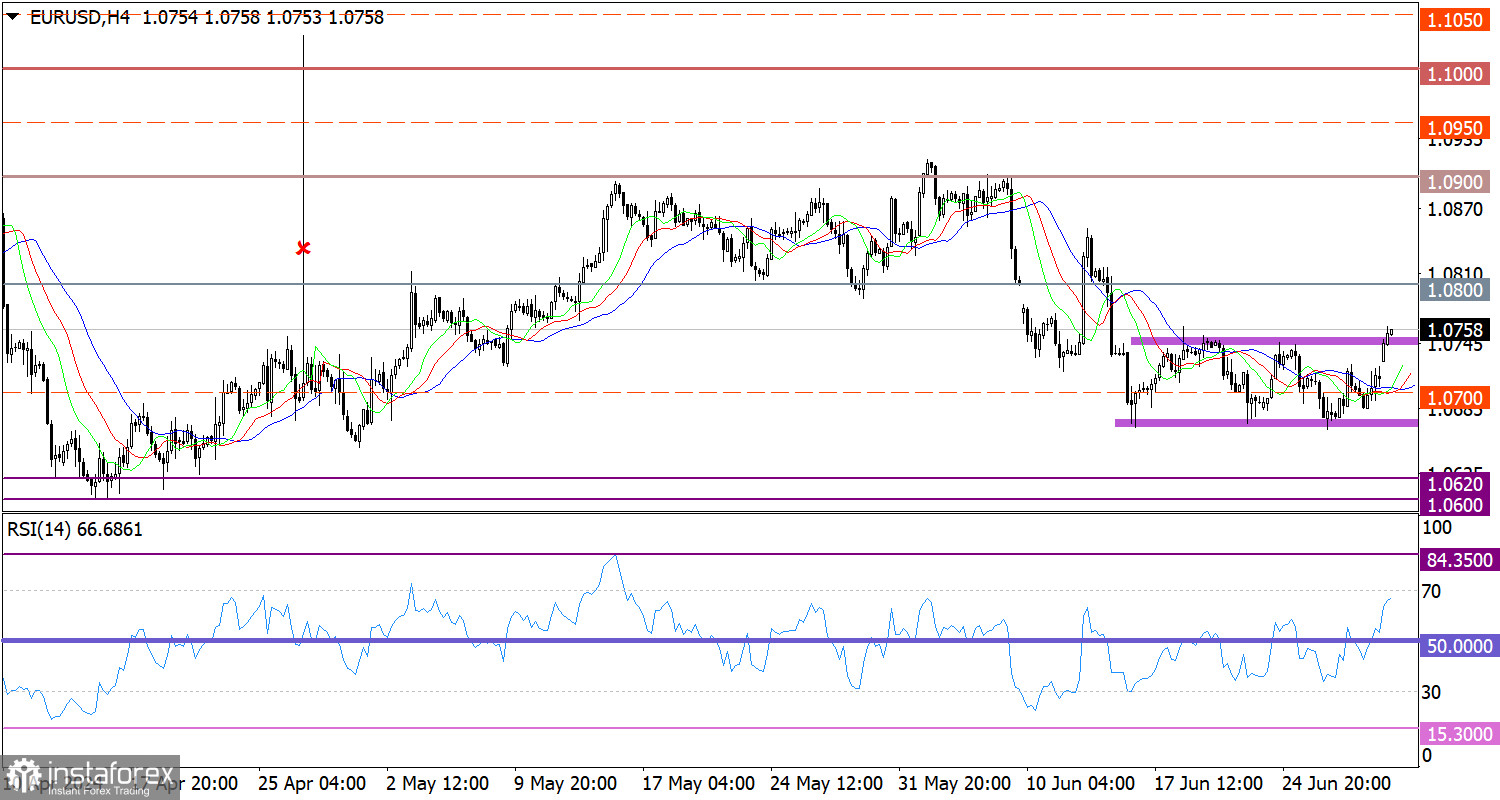
For the first time in two weeks, EUR/USD managed to break out of the 1.0670/1.0750 horizontal range. As a result, breaching the upper boundary of this range indicates an increase in the volume of long positions on the euro.
On the 4-hour chart, the RSI technical indicator is hovering in the upper area of 50/70, which points to the growth in the volume of long positions.
Meanwhile, the Alligator's MAs are intertwined in the 4-hour chart, which is a residual sign of the horizontal range.
In this case, keeping the price above the value of 1.0750 could indicate a subsequent rise in the euro, at least above the level of 1.0800. This would, in turn, mark the start of the euro's recovery relative to a longer corrective phase. However, if breaking the upper boundary of the range turns out to be a false signal and the price returns to the boundaries again, then the pair may continue to stay within the range.
The complex indicator analysis points to an upward cycle in the short-term and intraday periods.
*यहां पर लिखा गया बाजार विश्लेषण आपकी जागरूकता बढ़ाने के लिए किया है, लेकिन व्यापार करने के लिए निर्देश देने के लिए नहीं |
InstaSpot analytical reviews will make you fully aware of market trends! Being an InstaSpot client, you are provided with a large number of free services for efficient trading.


