


InstaSpot टीम में लीजेंड!
लीजेंड! आपको लगता है कि धमाकेदार बयानबाजी है? लेकिन हमें एक आदमी को कैसे बुलाना चाहिए, जो 18 साल की जूनियर विश्व शतरंज चैंपियनशिप जीतने वाला पहला एशियाई बना और 19 में पहला भारतीय ग्रैंडमास्टर कौन बना? यह विश्वनाथन आनंद के लिए विश्व चैंपियन खिताब के लिए एक कठिन मार्ग की शुरुआत थी, जो उस व्यक्ति के लिए हमेशा के लिए शतरंज का इतिहास बन गया। अब InstaSpot टीम में एक और लीजेंड!


बोरूसिया जर्मनी में सबसे अधिक शीर्षक वाले फुटबॉल क्लबों में से एक है, जो प्रशंसकों के लिए बार-बार साबित हुआ है: प्रतियोगिता और नेतृत्व की भावना निश्चित रूप से सफलता की ओर ले जाएगी। उसी तरह से व्यापार जिसमें खेल पेशेवर खेल खेलते हैं: आत्मविश्वास से और सक्रिय रूप से। बोरूसिया FC से एक "पास" रखें और InstaSpot के साथ नेतृत्व में रहें!

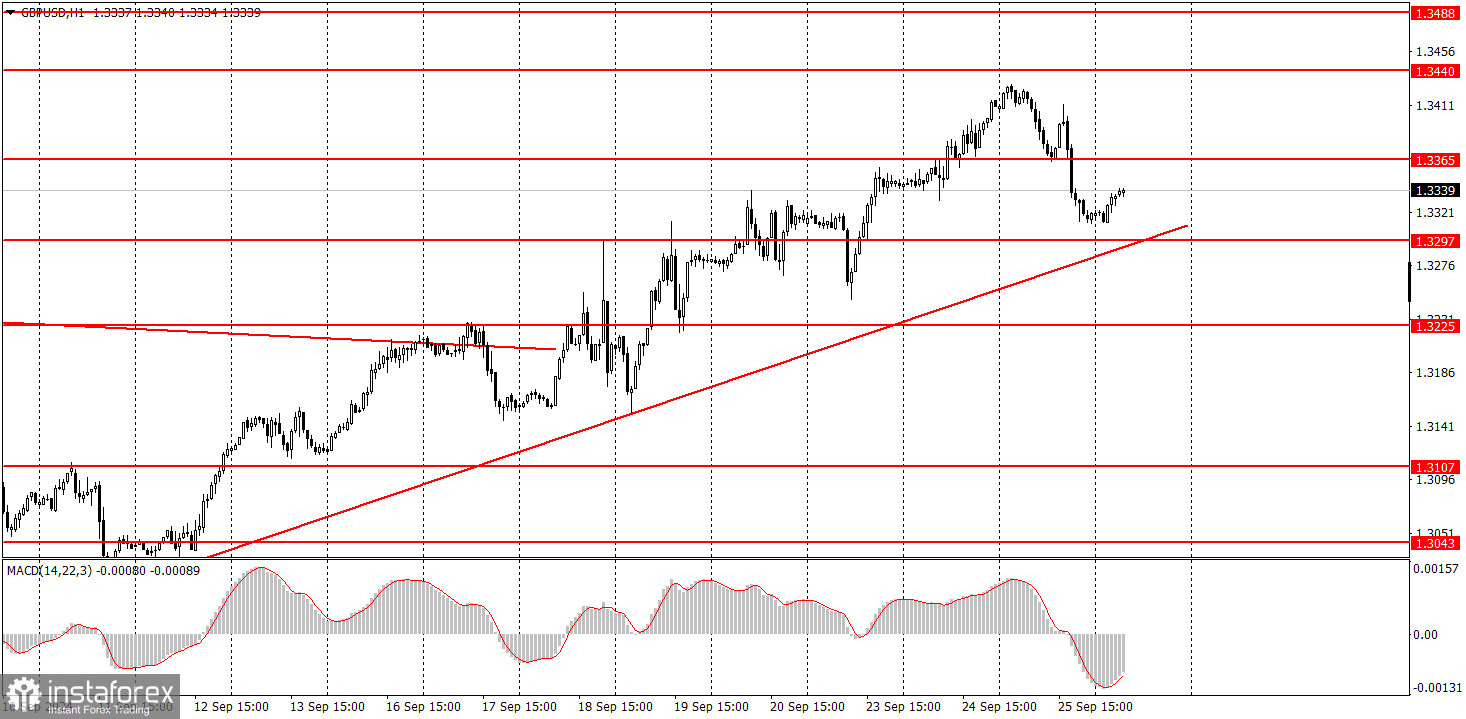
The GBP/USD pair also showed a significant decline on Wednesday, which seems surprising. On the one hand, even the pound needs to correct occasionally; as shown in the illustration above, even yesterday's 100-pip drop can't be called "strong." On the other hand, this decline in the British currency could be offset today, as the market doesn't need any reasons or justifications to sell the US dollar.
Today, Federal Reserve Chair Jerome Powell's speech will take place in the US, and the market could easily interpret it unfavorably for the US currency. That's precisely what it's been doing in 2024. Any positive or hawkish news is ignored, while negative or dovish news is acted upon with double zeal. Thus, the market might easily find the necessary dovish words in Powell's speech to rush to sell the dollar once again.
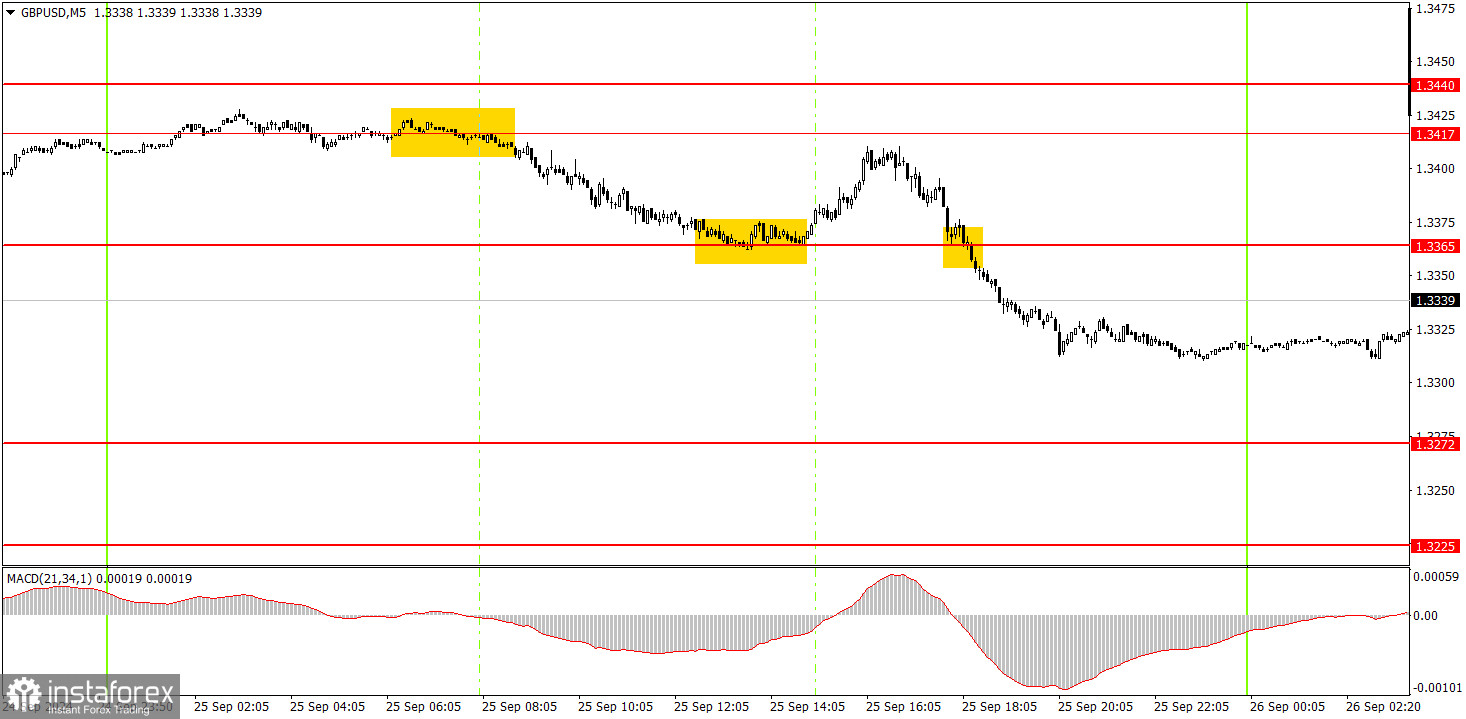
Three quite decent trading signals were formed in the 5-minute time frame on Wednesday. First, the price settled below the 1.3417 level, which triggered a fall to 1.3365. Then, the price bounced off this level but fell just a little short of reaching the nearest target of 1.3417. Afterward, it consolidated below the 1.3365 level and dropped another 40 pips. Thus, novice traders could have opened three trades, each of which could have brought some profit.
In the hourly time frame, the GBP/USD pair is again moving north, even though there are no grounds for this. This week, there has been a scarcity of news and macroeconomic reports, yet the pound actively rose during the first two days and fell sharply on Wednesday. In general, there's certainly no issue with volatility at the moment. The only problem lies in the logic behind the continuous growth of the British currency.
On Thursday, the pound sterling may resume its upward movement. Yesterday, it pulled back by as much as 100 pips, and today, baseless buying may resume. In any case, considering selling and expecting a drop in the pair would only be reasonable after the price consolidates below the trendline.
In the 5-minute time frame, trading can be conducted at the levels of 1.2913, 1.2980-1.2993, 1.3043, 1.3102-1.3107, 1.3145-1.3167, 1.3225, 1.3272, 1.3365, 1.3417-1.3440, 1.3488, and 1.3537. On Thursday, no significant events are scheduled in the UK, but significant reports on GDP and durable goods orders will be released in the US, and Powell is also set to speak. Movements could be strong and unexpected in the latter half of the day.
1) Signal Strength: The strength of a signal is determined by the time it takes to form (bounce or break through a level). The less time it takes, the stronger the signal.
2) False Signals: If two or more trades are opened near a certain level based on false signals, all subsequent signals from that level should be ignored.
3) Flat Market: In a flat market, any pair can generate numerous false signals or none at all. In any case, it's better to stop trading at the first signs of a flat market.
4) Trading Timeframe: Trades should be opened between the start of the European session and the middle of the American session, after which they should be closed manually.
5) MACD Indicator Signals: In the hourly time frame, it is preferable to trade based on MACD signals only when there is good volatility and a trend confirmed by a trendline or trend channel.
6) Close Levels: If two levels are located too close to each other (between 5 and 20 pips), they should be considered as a single support or resistance area.
7) Stop Loss: Once the price moves 15 pips in the intended direction, a Stop Loss should be set at the breakeven point.
Support and Resistance Price Levels: These levels serve as targets when opening buy or sell positions. They can also be used as points to set Take Profit levels.
Red Lines: These represent channels or trend lines that display the current trend and indicate the preferred trading direction.
MACD Indicator (14,22,3): The histogram and signal line serve as an auxiliary indicator that can also be used as a source of trading signals.
Important Speeches and Reports (always found in the news calendar) can significantly impact the movement of a currency pair. Therefore, trading should be done with maximum caution during their release, or you may choose to exit the market to avoid a sharp price reversal against the preceding movement.
For Beginners Trading on the Forex Market: It's essential to remember that not every trade will be profitable. Developing a clear strategy and practicing money management is key to achieving long-term success in trading.
*यहां पर लिखा गया बाजार विश्लेषण आपकी जागरूकता बढ़ाने के लिए किया है, लेकिन व्यापार करने के लिए निर्देश देने के लिए नहीं |
InstaSpot analytical reviews will make you fully aware of market trends! Being an InstaSpot client, you are provided with a large number of free services for efficient trading.


