


हमारी टीम के पास 7,000,000 से अधिक ट्रेडर हैं!
प्रतिदिन हम ट्रेडिंग को बेहतर बनाने के लिए एक साथ काम करते हैं। हम उच्च परिणाम प्राप्त कर रहे हैं और आगे की ओर बढ़ रहे हैं।
दुनियाभर के लाखों लोगों द्वारा हमारे काम को पहचानना, हमारे काम की सबसे अच्छी सराहना है! आपने आपनी पसंद बनाई है और हम आपकी अपेक्षाओं को पूरा करने के लिए हर संभव प्रयास करेंगे!
हम एक साथ एक अच्छी टीम हैं!
इंस्टाफॉरेक्स को इस बात का गर्व है कि वह आपके लिए काम कर रहा है!


एक्टर, यूएफसी 6 टूर्नामेंट का विजेता और एक सच्चा हीरो!
वह आदमी, जिसने अपनी मेहनत से सब किया है। वह आदमी, जो हमारे रास्तों पर चलता है.
टैक्टारोव की सफलता का राज लक्ष्य की ओर लगातर अग्रसर रहना है।
अपनी प्रतिभा के सभी पक्षों को प्रकट करें!
खोज करें, कोशिश करें, विफल हो-लेकिन कभी न रूकें!
इंस्टाफॉरेक्स- हमारी सफलताओं की कहानी यहाँ से शुरू होती है!

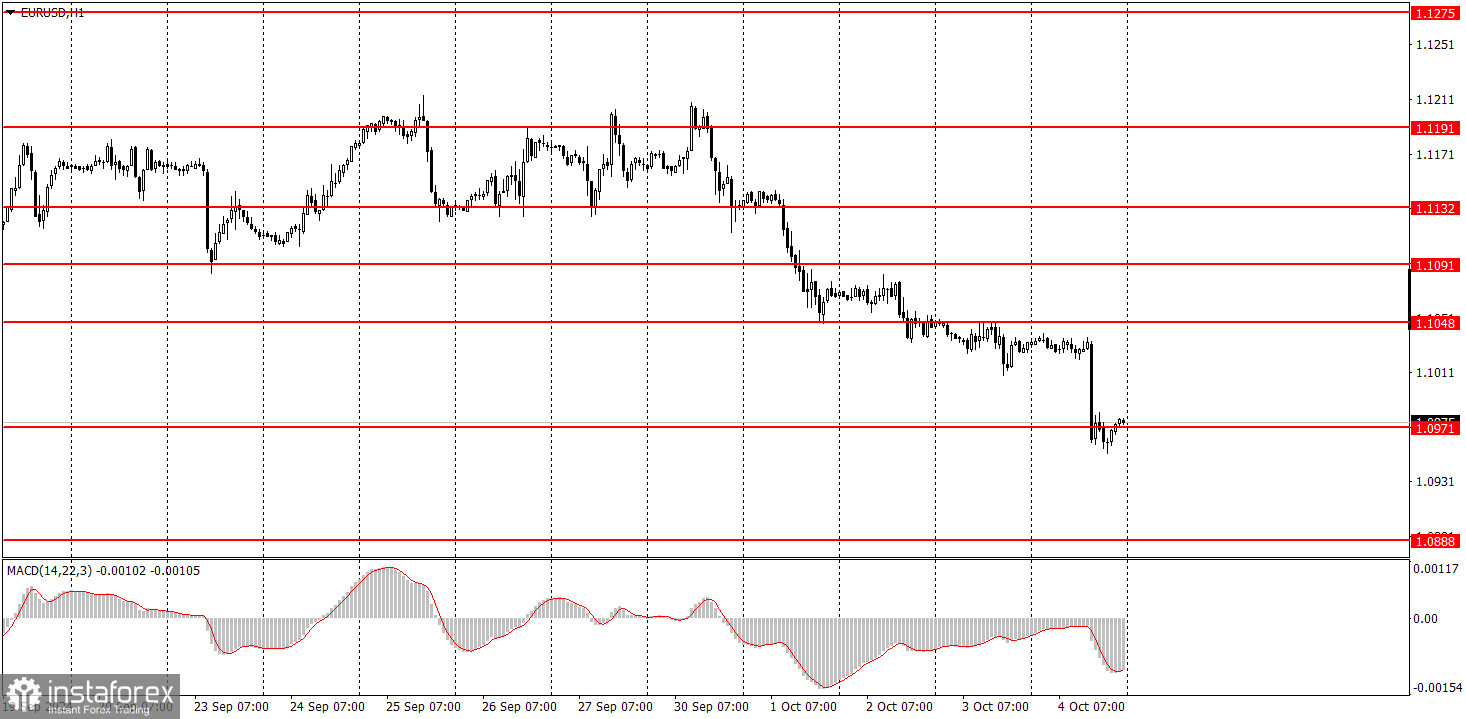
The EUR/USD currency pair resumed a strong decline on Friday, which had been ongoing throughout the week. Of course, the main and, essentially, the only reason for the rise of the US dollar on Friday was the macroeconomic data from the US, which the market had been anticipating since the start of the week. The NonFarm Payrolls report showed a result in September that was almost twice as high as forecasts, ending a period of weak job creation. At the same time, the unemployment rate fell to 4.1%, which the market did not expect. These two reports caused the dollar to rise again.
However, we want to remind you that the US currency remains undervalued and oversold overall. Thus, even without these reports, the dollar should rise, and the euro should fall. The market has been factoring in the Federal Reserve's monetary policy easing for two years now, while the fact that the European Central Bank has been lowering rates was largely ignored recently. But now, the situation is beginning to change.
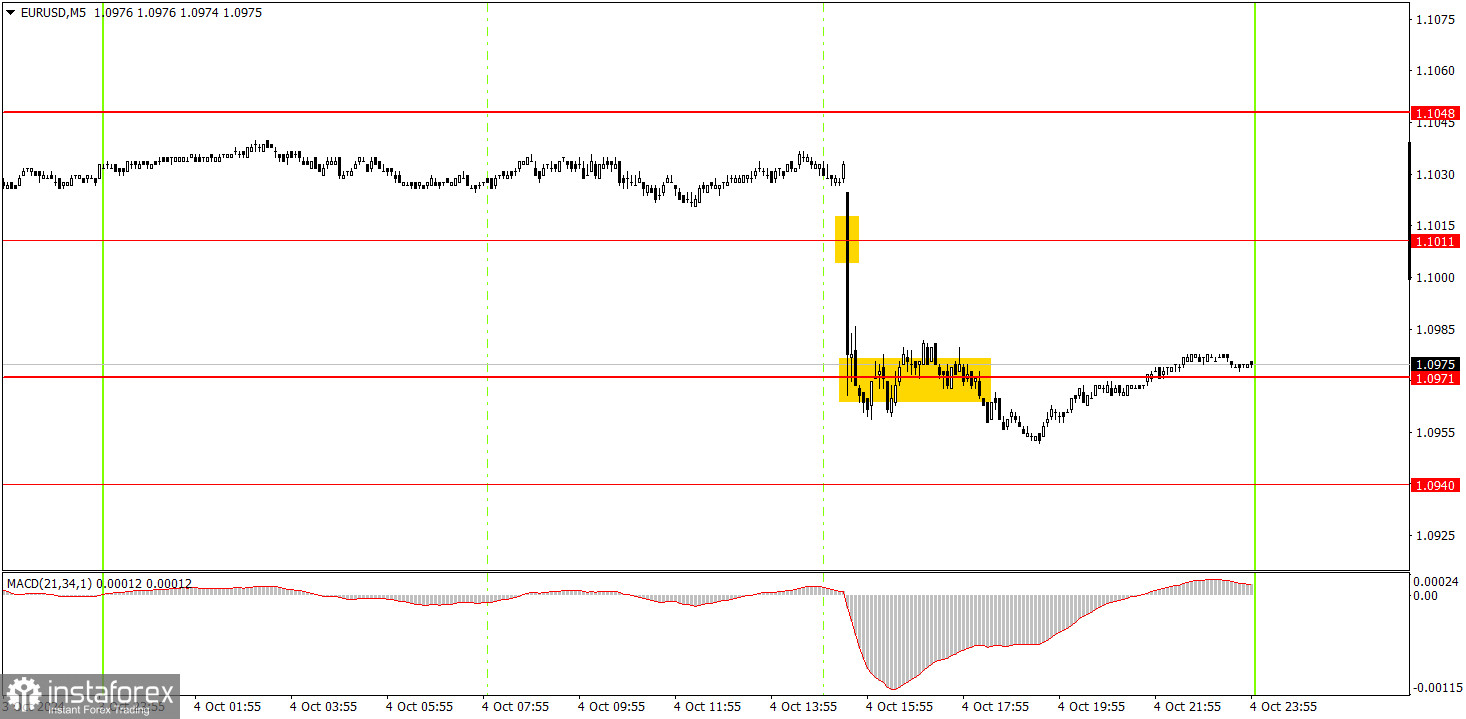
Two sell signals were formed in the 5-minute time frame on Friday. First, the price consolidated below the 1.1011 level, then broke through the 1.0973 level. However, these signals were challenging to execute. After the US reports were released, the price dropped by 65 pips in 5 minutes, so trading could only be done using pending orders. The second sell signal formed when the downward momentum had nearly exhausted.
The EUR/USD pair moved significantly towards a downward trend this week in the hourly time frame. Unfortunately, illogical dollar sales could resume in the medium term, as no one knows how long the market will continue to process the Fed's monetary easing. However, at this time, there is a downward trend in the hourly time frame. After a correction, a further decline in the euro can be expected.
You can trade from the 1.0971 level on Monday. Since the euro has been falling for five consecutive days, a correction next week is quite likely, so be prepared for a slight increase.
In the 5-minute time frame, the following levels should be considered: 1.0726-1.0733, 1.0797-1.0804, 1.0838-1.0856, 1.0888-1.0896, 1.0940, 1.0971, 1.1011, 1.1048, 1.1091, 1.1132-1.1140, 1.1189-1.1191, 1.1275-1.1292. On Monday, the Eurozone will release a retail sales report, the only event on the first day of the new week. We can most likely expect relatively weak movements with a corrective bias.
Support and Resistance Price Levels: These levels serve as targets when opening buy or sell positions. They can also be used as points to set Take Profit levels.
Red Lines: These represent channels or trend lines that display the current trend and indicate the preferred trading direction.
MACD Indicator (14,22,3): The histogram and signal line serve as an auxiliary indicator that can also be used as a source of trading signals.
Important Speeches and Reports (always found in the news calendar) can significantly impact the movement of a currency pair. Therefore, trading should be done with maximum caution during their release, or you may choose to exit the market to avoid a sharp price reversal against the preceding movement.
For Beginners Trading on the Forex Market: It's essential to remember that not every trade will be profitable. Developing a clear strategy and practicing money management is key to achieving long-term success in trading.
*यहां पर लिखा गया बाजार विश्लेषण आपकी जागरूकता बढ़ाने के लिए किया है, लेकिन व्यापार करने के लिए निर्देश देने के लिए नहीं |
InstaSpot analytical reviews will make you fully aware of market trends! Being an InstaSpot client, you are provided with a large number of free services for efficient trading.


