


हमारी टीम के पास 7,000,000 से अधिक ट्रेडर हैं!
प्रतिदिन हम ट्रेडिंग को बेहतर बनाने के लिए एक साथ काम करते हैं। हम उच्च परिणाम प्राप्त कर रहे हैं और आगे की ओर बढ़ रहे हैं।
दुनियाभर के लाखों लोगों द्वारा हमारे काम को पहचानना, हमारे काम की सबसे अच्छी सराहना है! आपने आपनी पसंद बनाई है और हम आपकी अपेक्षाओं को पूरा करने के लिए हर संभव प्रयास करेंगे!
हम एक साथ एक अच्छी टीम हैं!
इंस्टाफॉरेक्स को इस बात का गर्व है कि वह आपके लिए काम कर रहा है!


एक्टर, यूएफसी 6 टूर्नामेंट का विजेता और एक सच्चा हीरो!
वह आदमी, जिसने अपनी मेहनत से सब किया है। वह आदमी, जो हमारे रास्तों पर चलता है.
टैक्टारोव की सफलता का राज लक्ष्य की ओर लगातर अग्रसर रहना है।
अपनी प्रतिभा के सभी पक्षों को प्रकट करें!
खोज करें, कोशिश करें, विफल हो-लेकिन कभी न रूकें!
इंस्टाफॉरेक्स- हमारी सफलताओं की कहानी यहाँ से शुरू होती है!

On the monthly chart, the price has reached the Fibonacci channel line (marked with a bold green line from the low to the high).
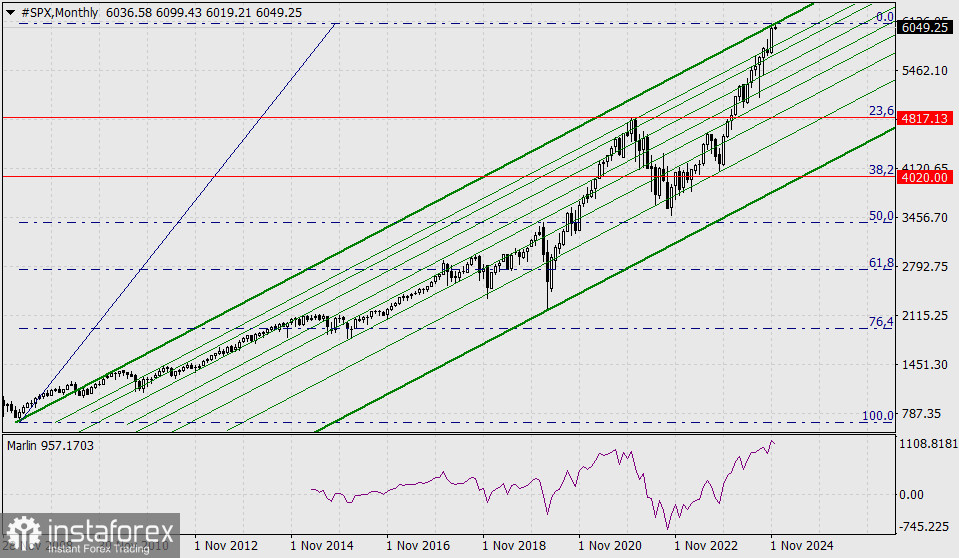
The Fibonacci grid accurately describes this upward movement, beginning in March 2009, as its levels—23.6%, 38.2%, 50.0%, 61.8%, and even 76.4%—align precisely with the extremes and support levels over the past 15 years. The Marlin oscillator indicates an intention to reverse from the overbought zone.
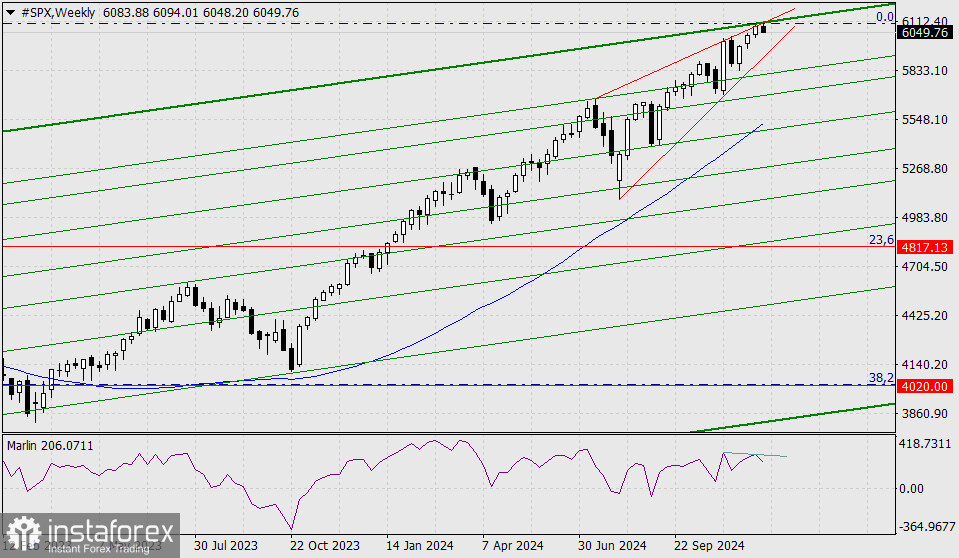
On the weekly chart, the price reverses from the upper boundary of a rising (reversal) wedge. A divergence has formed between the price and the Marlin oscillator. A deep correction is possible, bringing the index to the 23.6% Fibonacci level at 4817.13, which aligns with the January 2022 peak. Such a decline would correspond to a 20.95% drop from the record high.
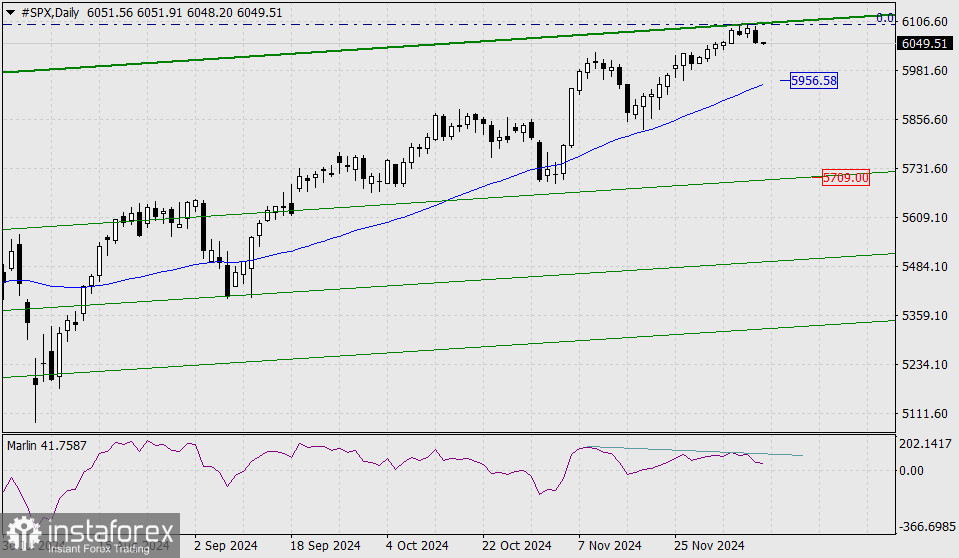
On the daily chart, a divergence is also ready to play out. The first target for the decline is the MACD line near 5956.58, corresponding to the November 26 low. The second target is 5709.00, aligned with the nearest embedded line of the green diagonal price channel. This level is close to the support area from November 1–4.
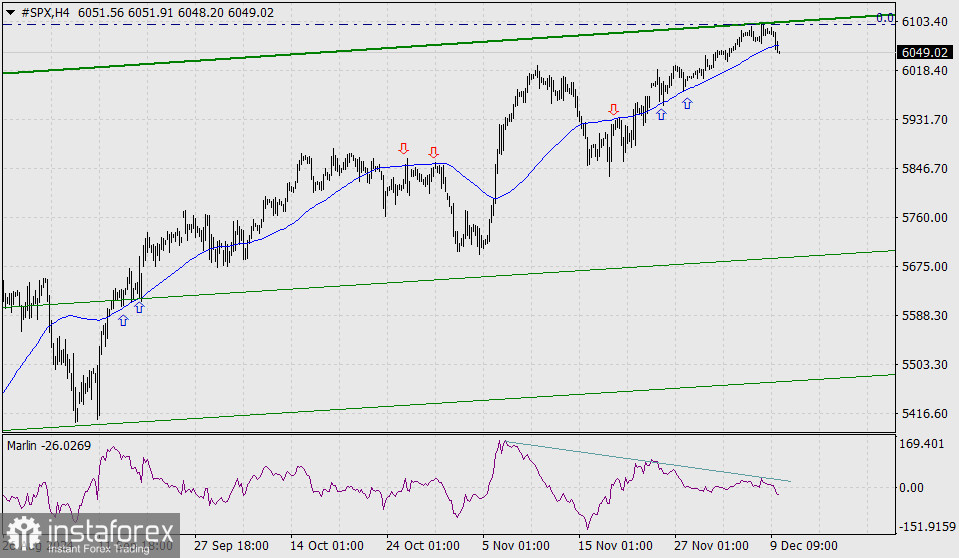
On the four-hour chart, the price has consolidated below the MACD line. A double divergence has formed between the price and the Marlin oscillator, with the oscillator moving into the downward zone. The current situation is definitively bearish. The market's next critical test will be the upcoming Federal Reserve meeting.
*यहां पर लिखा गया बाजार विश्लेषण आपकी जागरूकता बढ़ाने के लिए किया है, लेकिन व्यापार करने के लिए निर्देश देने के लिए नहीं |
InstaSpot analytical reviews will make you fully aware of market trends! Being an InstaSpot client, you are provided with a large number of free services for efficient trading.
फॉरेक्स (विदेशी मुद्रा) संबंधी चार्ट
वेब-संस्करण

Your IP address shows that you are currently located in the USA. If you are a resident of the United States, you are prohibited from using the services of InstaFintech Group including online trading, online transfers, deposit/withdrawal of funds, etc.
If you think you are seeing this message by mistake and your location is not the US, kindly proceed to the website. Otherwise, you must leave the website in order to comply with government restrictions.
Why does your IP address show your location as the USA?
Please confirm whether you are a US resident or not by clicking the relevant button below. If you choose the wrong option, being a US resident, you will not be able to open an account with InstaSpot anyway.
We are sorry for any inconvenience caused by this message.


