वास्तविक पैटर्न

पैटर्न ग्राफिकल मॉडल हैं जो चार्ट में मूल्य से बने होते हैं। तकनीकी विश्लेषण भविष्यवाणियों में से एक के अनुसार, इतिहास का मतलब मूल्य आंदोलन खुद को दोहराता है। इसका मतलब है कि मूल्य आंदोलन अक्सर एक ही परिस्थितियों में समान होते हैं जो उच्च संभावना के साथ स्थिति के आगे के विकास की भविष्यवाणी करना संभव बनाता है।
इंस्टा फॉरेक्स द्वारा प्रासंगिक पैटर्न एक उपयोग में आसान सेवा है जो आपको बाजार में नवीनतम परिवर्तनों के बारे में जागरूक होने और समय पर बाजार से संकेतों पर प्रतिक्रिया करने की अनुमति देती है। हमारी सेवा में आप हमेशा किसी भी जोड़ी और किसी भी समय सीमा पर नवीनतम और सबसे प्रासंगिक पैटर्न प्राप्त कर सकते हैं.
Bearish pennant
was formed on 07.04 at 00:30:13 (UTC+0)
signal strength 3 of 5
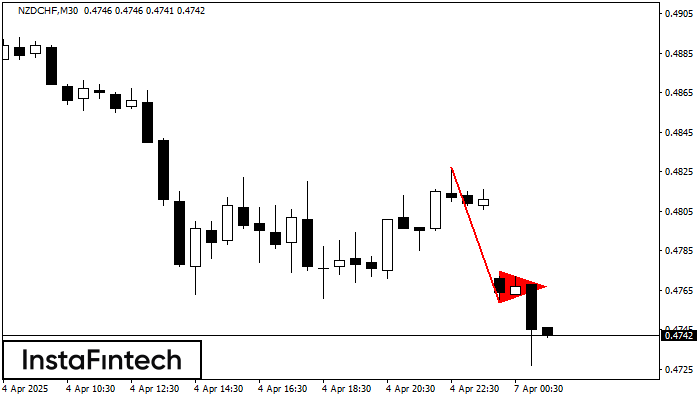
The Bearish pennant pattern has formed on the NZDCHF M30 chart. It signals potential continuation of the existing trend. Specifications: the pattern’s bottom has the coordinate of 0.4759; the projection of the flagpole height is equal to 68 pips. In case the price breaks out the pattern’s bottom of 0.4759, the downtrend is expected to continue for further level 0.4729.
- All
- All
- Bullish Rectangle
- Bullish Symmetrical Triangle
- Bullish Symmetrical Triangle
- Double Bottom
- Double Top
- Double Top
- Triple Top
- Triple Top
- Triple Top
- Triple Top
- All
- All
- Buy
- Sale
- All
- 1
- 2
- 3
- 4
- 5
Double Top
was formed on 10.04 at 16:00:14 (UTC+0)
signal strength 3 of 5
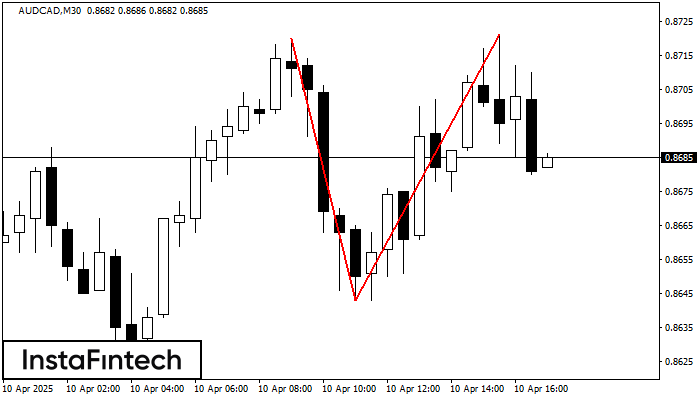
Pada carta AUDCAD M30 corak pembalikan Double Top telah terbentuk. Ciri-ciri: sempadan atas 0.8721; sempadan bawah 0.8643; lebar corak 78 mata. Isyarat: penembusan sempadan bawah akan menyebabkan kesinambungan arah aliran
Open chart in a new window
Segi Empat Menurun
was formed on 10.04 at 15:50:39 (UTC+0)
signal strength 1 of 5
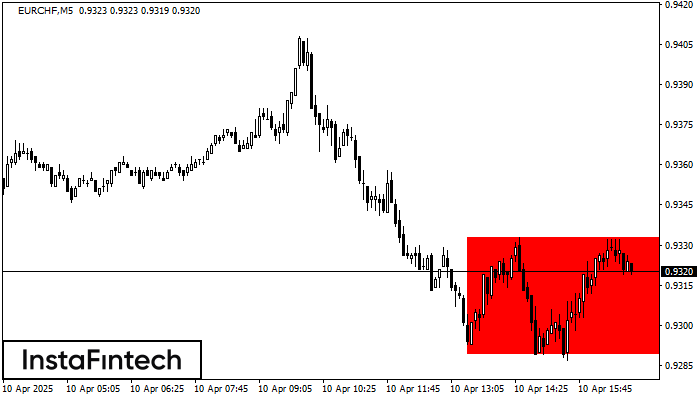
Berdasarkan carta M5, EURCHF telah membentuk Segi Empat Menurun. Jenis corak ini menunjukkan kesinambungan aliran. Ia terdiri daripada dua tahap: rintangan 0.9333 - 0.0000 dan sokongan 0.9289 – 0.9289. Sekiranya
Carta masa M5 dan M15 mungkin mempunyai lebih banyak titik kemasukan palsu.
Open chart in a new window
Double Top
was formed on 10.04 at 15:00:21 (UTC+0)
signal strength 2 of 5
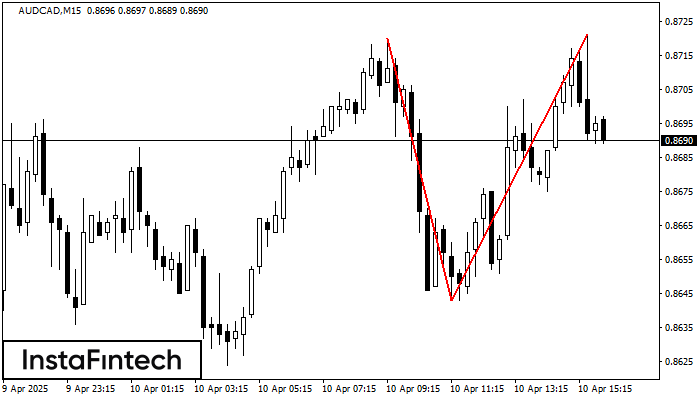
Pada carta AUDCAD M15 corak pembalikan Double Top telah terbentuk. Ciri-ciri: sempadan atas 0.8721; sempadan bawah 0.8643; lebar corak 78 mata. Isyarat: penembusan sempadan bawah akan menyebabkan kesinambungan arah aliran
Carta masa M5 dan M15 mungkin mempunyai lebih banyak titik kemasukan palsu.
Open chart in a new window