


Nella nostra squadra ci sono più di 7.000.000 trader! Ogni giorno ci impegniamo a far sì che il trading migliori. Conseguiamo grandi risultati e ci muoviamo in avanti.
Il riconoscimento da parte di milioni di trader in tutto il mondo rappresenta l'alta valutazione della nostra attività! Voi avete fatto la vostra scelta e noi faremo la nostra al fine di soddisfare le vostre aspettative!
Assieme siamo una grande squadra!
InstaSpot. Siamo orgogliosi di lavorare per voi!


Attore, campione del mondo di lotta libera e semplicemente un vero maciste russo! Persona venuta dal nulla. Persona che rispecchia i nostri obiettivi. Il segreto del successo di Taktarov consiste nel mirare continuamente al suo scopo.
Dischiudi anche tu tutti gli aspetti del tuo talento! Impara, prova, sbaglia, ma non fermarti!
InstaSpot - la storia delle tue vittorie inizia qui!

Gold was trading at 1,841 at the time of writing. The price action developed an up-channel pattern which could represent a downside continuation formation. After its massive drop, the price rebounded and recovered a little. You knew from my previous analyses that the price of gold could register only a temporary rebound.
Technically, the bias is bearish, so temporary growth could bring new selling opportunities. XAU/USD is vulnerable to dropping deeper. The US JOLTS Job Openings, ISM Services PMI, and the Final Services PMI came in better than expected. Also, the FOMC Meeting Minutes confirmed a 50bps or 75bps rate hike in the July meeting.
Tomorrow, the fundamentals could drive the market. The US NFP, Unemployment Rate, and the Average Hourly Earnings will be released.
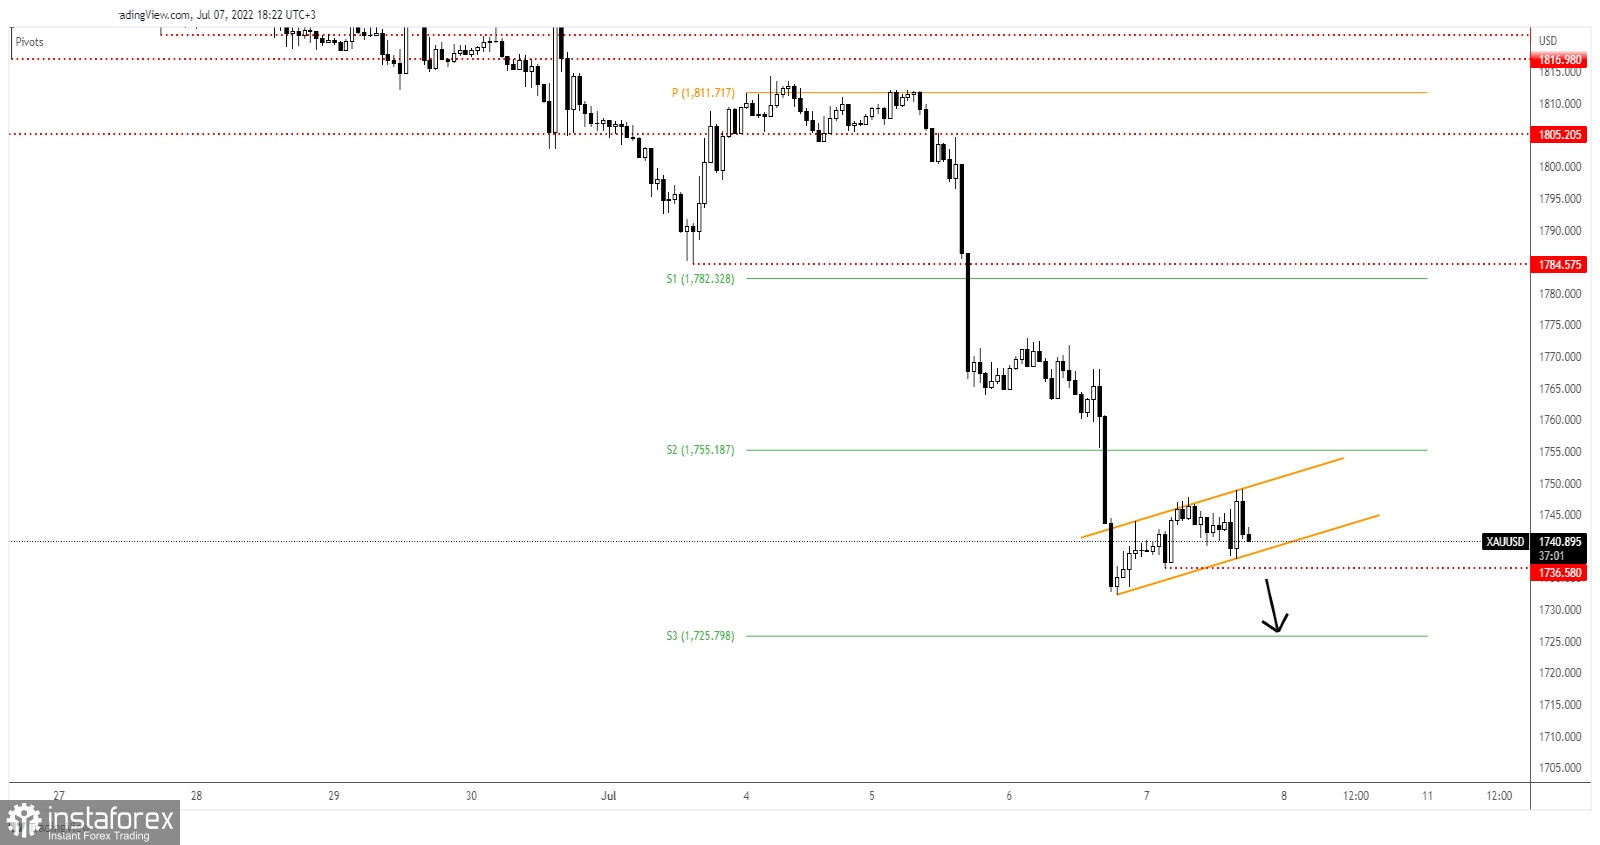
As you can see on the H1 chart, XAU/USD is trapped within an ascending channel pattern. A downside breakout could announce more declines. The price failed to approach and reach the weekly S2 (1,755) which represents an upside obstacle signaling strong selling pressure.
The 1,736 former low stands as static support, while the minor uptrend line represents dynamic support. The resistance is seen at the channel's upside line.
A new lower low, a valid breakdown below the uptrend line and below the 1,736 could validate a potential further drop towards the weekly S3 of 1,725. This scenario could bring new selling opportunities.
*La presente analisi del mercato ha un carattere esclusivamente informativo e non rappresenta una guida per l`effettuazione di una transazione.
Le recensioni analitiche di InstaSpot ti renderanno pienamente consapevole delle tendenze del mercato! Essendo un cliente InstaSpot, ti viene fornito un gran numero di servizi gratuiti per il trading efficiente.


