


Nella nostra squadra ci sono più di 7.000.000 trader! Ogni giorno ci impegniamo a far sì che il trading migliori. Conseguiamo grandi risultati e ci muoviamo in avanti.
Il riconoscimento da parte di milioni di trader in tutto il mondo rappresenta l'alta valutazione della nostra attività! Voi avete fatto la vostra scelta e noi faremo la nostra al fine di soddisfare le vostre aspettative!
Assieme siamo una grande squadra!
InstaSpot. Siamo orgogliosi di lavorare per voi!


Attore, campione del mondo di lotta libera e semplicemente un vero maciste russo! Persona venuta dal nulla. Persona che rispecchia i nostri obiettivi. Il segreto del successo di Taktarov consiste nel mirare continuamente al suo scopo.
Dischiudi anche tu tutti gli aspetti del tuo talento! Impara, prova, sbaglia, ma non fermarti!
InstaSpot - la storia delle tue vittorie inizia qui!

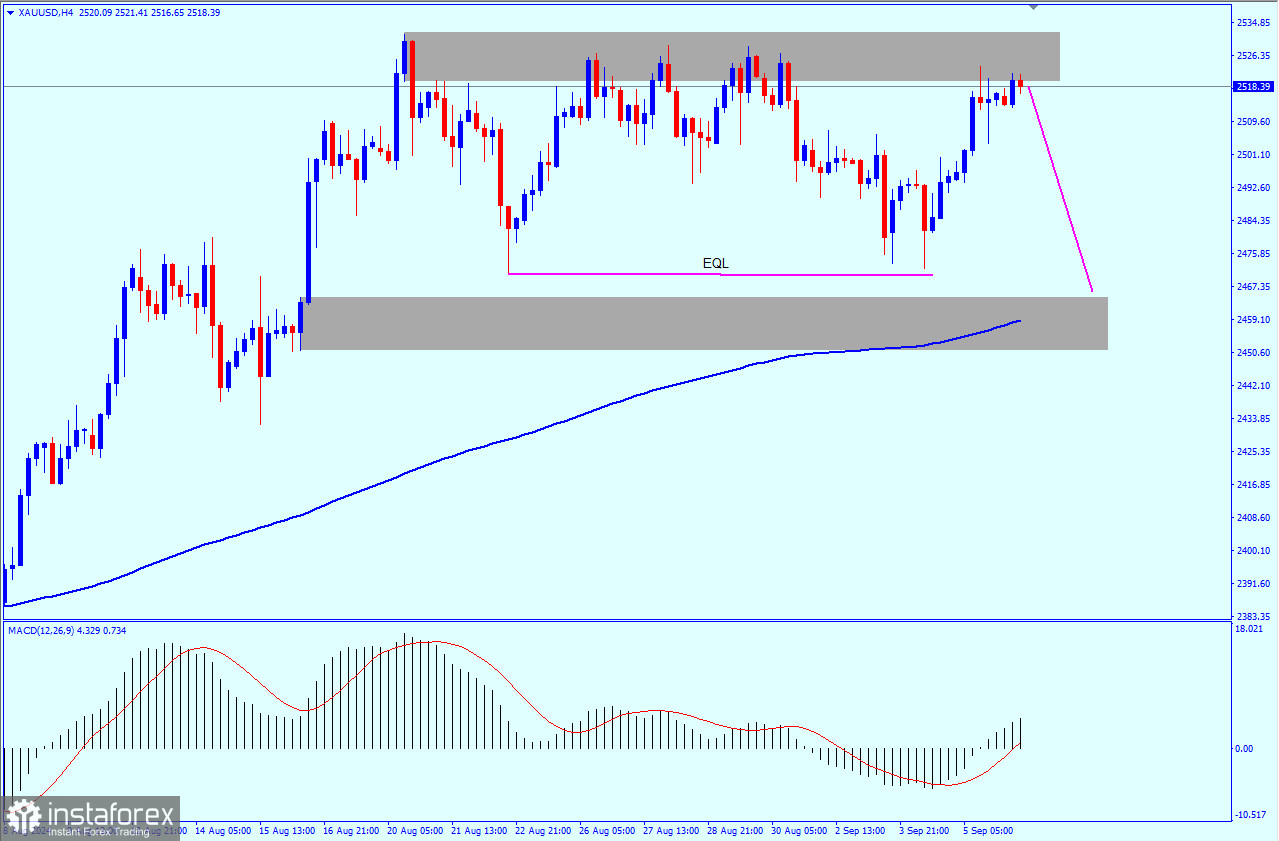
H4
In the four-hour chart, gold is in a sideways channel. This may be the stage that precedes the decline because this sideways trend occurred after a strong rise in the previous weeks. So, it may go through some corrective declines if it intends to rise again.
There is a good sign of a decline, as there is an Equal Low Level, which represents liquidity for retail traders. The price may fall to this level to make traders lose and then rebound from the order block at the level of 2,464.50.
What supports the idea of buying from this level is the EQL, as we mentioned previously, and the presence of the 200-moving average below this area, which will represent a good support area for the instrument to rebound from.
Points of interest (POI)
Buy from: 2,464.50 (it is not recommended to sell in the hope the price will fall to this level)
TP 1: 2,495 (1:2 RR)
TP 2: 2,532 (can target to break the main high)
Stop loss: 2,451 (below the OB and the MA as well)
Monthly chart
Since gold breaks every high it makes, there is no good area for gold to bounce from in the monthly time frame. The only chance to enter a trade is with the general bullish trend, but there is no chance to enter a buy trade yet either, so waiting is the best solution.
Weekly chart
In the weekly time frame, we may see some bearish movements, especially since two good signals may support the decline. There is a bullish channel that gold has formed, and a price action signal appeared at the top of this channel. The second signal is the divergence in the MACD. This is also a signal that supports the decline.
Daily chart
Almost the same thing happened in the daily time frame, but the picture became a little clearer, as the opportunity will be better in case of breaking the internal upward trend on the daily. A decline may occur after that to complete the rise if we do not see any other indication of gold weakness.
If you look at the MACD indicator, you will notice that there is a weakness in the bullish momentum. The buying activity is decreasing day after day. If gold makes lower lows, it could lose ground.
Economic news
There will be strong news in the economic calendar today: the US nonfarm payrolls. If the price does not reach the POI today even with the NFP, the POI will be valid next week
*La presente analisi del mercato ha un carattere esclusivamente informativo e non rappresenta una guida per l`effettuazione di una transazione.
Le recensioni analitiche di InstaSpot ti renderanno pienamente consapevole delle tendenze del mercato! Essendo un cliente InstaSpot, ti viene fornito un gran numero di servizi gratuiti per il trading efficiente.


