


Nella nostra squadra ci sono più di 7.000.000 trader! Ogni giorno ci impegniamo a far sì che il trading migliori. Conseguiamo grandi risultati e ci muoviamo in avanti.
Il riconoscimento da parte di milioni di trader in tutto il mondo rappresenta l'alta valutazione della nostra attività! Voi avete fatto la vostra scelta e noi faremo la nostra al fine di soddisfare le vostre aspettative!
Assieme siamo una grande squadra!
InstaSpot. Siamo orgogliosi di lavorare per voi!


Attore, campione del mondo di lotta libera e semplicemente un vero maciste russo! Persona venuta dal nulla. Persona che rispecchia i nostri obiettivi. Il segreto del successo di Taktarov consiste nel mirare continuamente al suo scopo.
Dischiudi anche tu tutti gli aspetti del tuo talento! Impara, prova, sbaglia, ma non fermarti!
InstaSpot - la storia delle tue vittorie inizia qui!

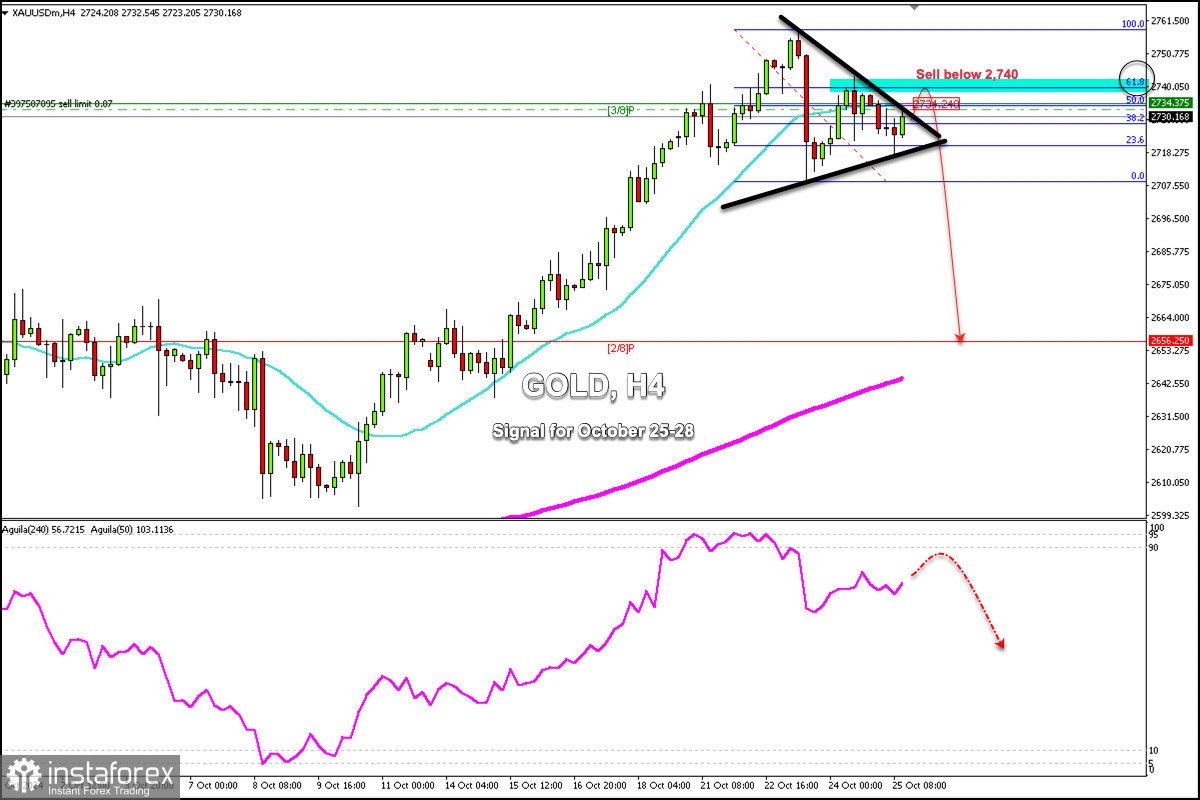
Early in the American session, gold is trading around 2,730 within the symmetrical triangle pattern forming since October 21, below 3/8 Murray, and below the 21 SMA.
On the H4 chart, we can see that after having made a strong technical correction from the high of 2,758 to the low of 2,708, gold is reaching the 61.8% zone, which means that the metal could resume its bearish cycle.
We could look for opportunities to sell gold if the price approaches 2,734 or 2,740 in the next few hours. Both levels act as strong resistance and suggest an opportunity to sell.
Technically, gold is overbought. So, as long as the instrument trades below the 61.8% Fibonacci at 2,740, any technical bounce will be seen as an opportunity to sell.
In case gold falls below the 32.8% Fibonacci level located around 2,728, we could expect a further bearish movement. If this scenario comes true, we can sell with targets at 2,696, and finally at 2/8 of Murray at 2,656.
*La presente analisi del mercato ha un carattere esclusivamente informativo e non rappresenta una guida per l`effettuazione di una transazione.
Le recensioni analitiche di InstaSpot ti renderanno pienamente consapevole delle tendenze del mercato! Essendo un cliente InstaSpot, ti viene fornito un gran numero di servizi gratuiti per il trading efficiente.


