


Nella nostra squadra ci sono più di 7.000.000 trader! Ogni giorno ci impegniamo a far sì che il trading migliori. Conseguiamo grandi risultati e ci muoviamo in avanti.
Il riconoscimento da parte di milioni di trader in tutto il mondo rappresenta l'alta valutazione della nostra attività! Voi avete fatto la vostra scelta e noi faremo la nostra al fine di soddisfare le vostre aspettative!
Assieme siamo una grande squadra!
InstaSpot. Siamo orgogliosi di lavorare per voi!


Attore, campione del mondo di lotta libera e semplicemente un vero maciste russo! Persona venuta dal nulla. Persona che rispecchia i nostri obiettivi. Il segreto del successo di Taktarov consiste nel mirare continuamente al suo scopo.
Dischiudi anche tu tutti gli aspetti del tuo talento! Impara, prova, sbaglia, ma non fermarti!
InstaSpot - la storia delle tue vittorie inizia qui!

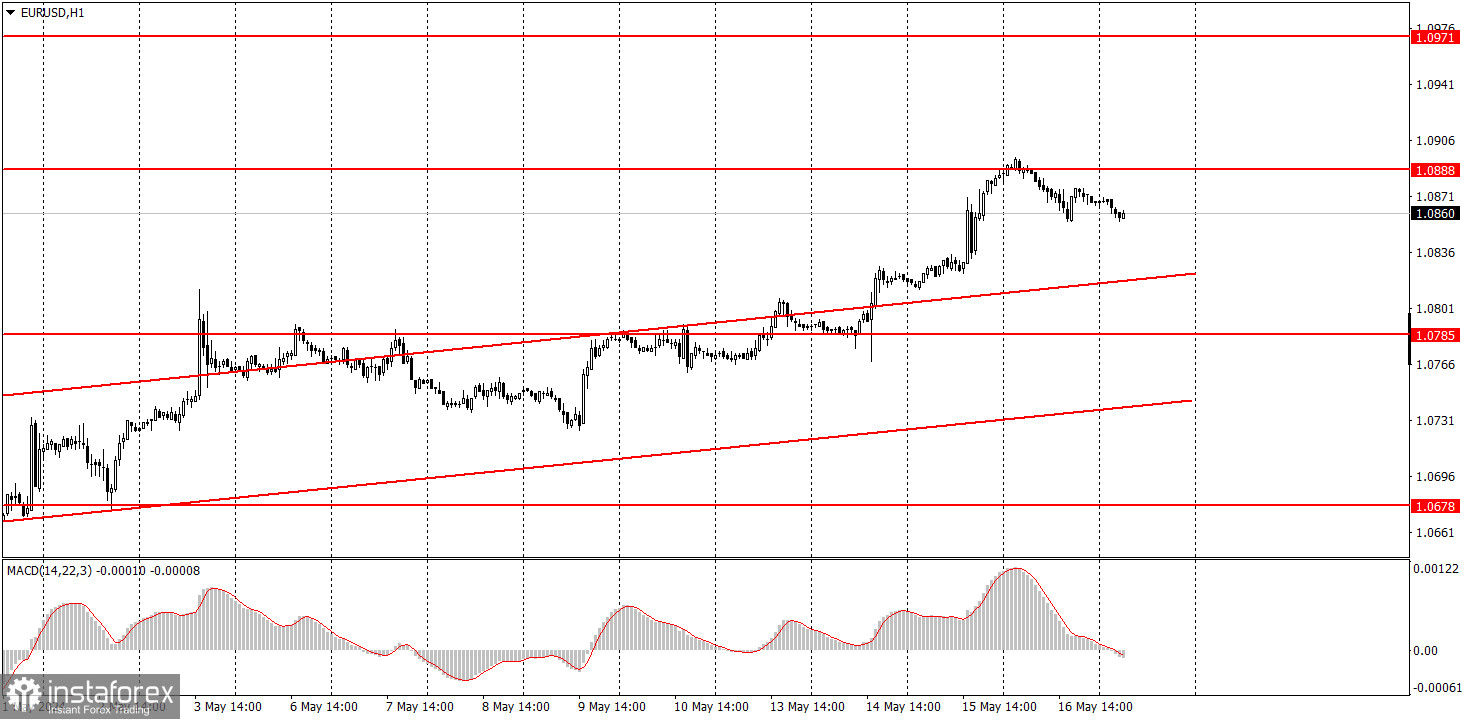
The EUR/USD started a minor correction, and it may continue this movement on Friday. A decline of 30-40 pips is nothing if we compare it to a month-long period of upward movement. The price has not overcome the level of 1.0888 on the first attempt, but this doesn't mean that the bulls have left the market. The pair could still rise. First of all, the market remains bullish, and the euro continues to rise even when it has no grounds to do so. For some, the current movement may seem logical, especially considering the latest macro data from the US. This is indeed partly true. However, we want to remind everyone of a crucial fundamental factor that should fuel the dollar's growth. The key point is that the European Central Bank's interest rates are set to decrease as soon as next month, while the Federal Reserve's rates are not expected to change anytime soon. In addition, market participants are no longer impressed by the European economy's performance. Therefore, we believe that the pair's current growth is illogical. However, we shouldn't expect a downtrend when the price has not consolidated below the ascending channel.
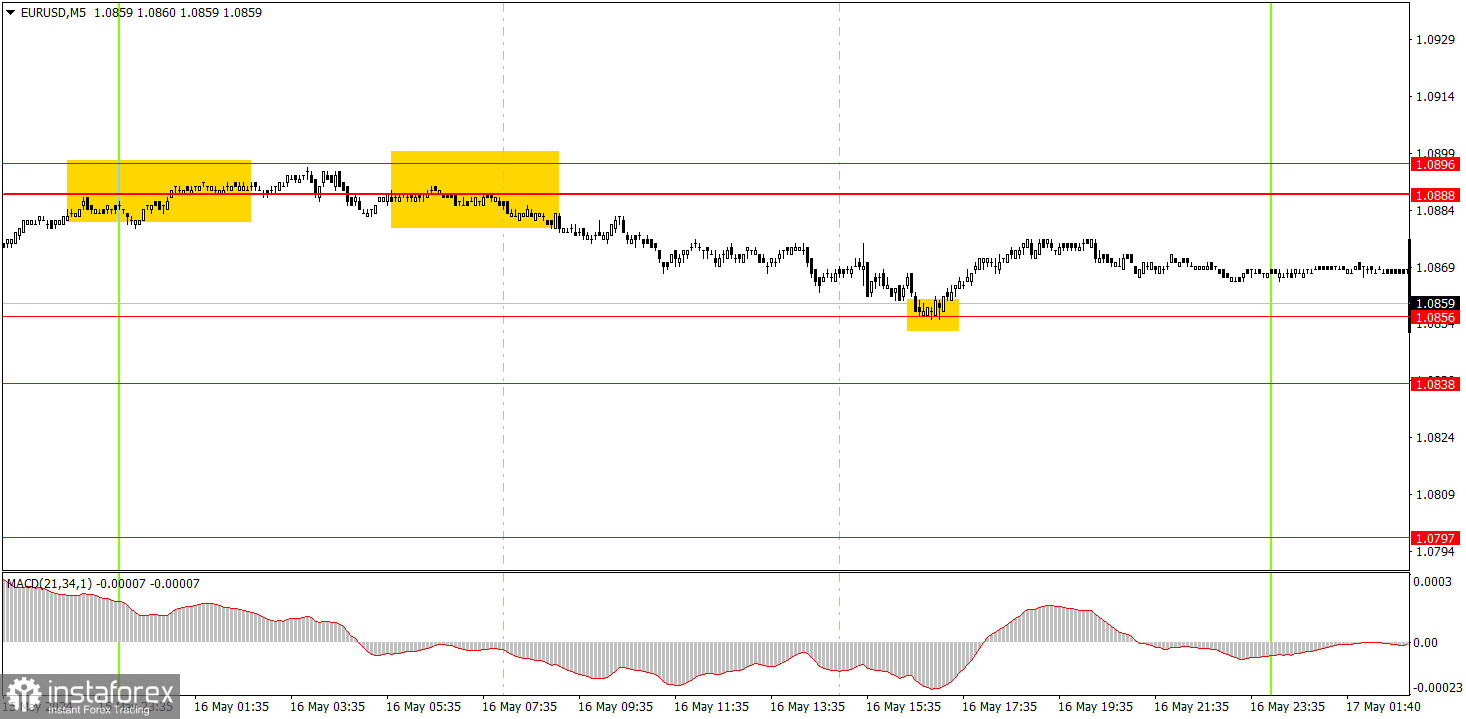
Despite the modest amount of volatility, two good and accurate trading signals were formed on the 5-minute timeframe. Initially, the pair bounced off the level of 1.0888, and then off the level of 1.0856. Since the distance between these levels is only 32 pips,
the profit from the trades could not have been high. Nevertheless, in the face of low volatility, beginners managed to earn around 20-25 pips, which is also quite good.
On the hourly chart, the EUR/USD pair continues to correct higher, which is increasingly resembling an independent trend. We believe that the decline should resume in the medium term, as the euro remains expensive, and the overall trend is downward. The fundamental background still supports the US dollar, and the inflation report for April will not change the Fed's stance.
On Friday, novice traders can continue to look for buy signals around the area of 1.0838-1.0856. If the price consolidates below this area, then it may continue to fall towards 1.0785-1.0797.
The key levels on the 5M chart are 1.0483, 1.0526, 1.0568, 1.0611, 1.0678, 1.0725-1.0733, 1.0785-1.0797, 1.0838-1.0856, 1.0888-1.0896, 1.0940, 1.0971-1.0981. On Friday, we can only highlight the second estimate of the Eurozone inflation report for April. However, this report is of secondary importance. The US event calendar is empty.
1) Signal strength is determined by the time taken for its formation (either a bounce or level breach). A shorter formation time indicates a stronger signal.
2) If two or more trades around a certain level are initiated based on false signals, subsequent signals from that level should be disregarded.
3) In a flat market, any currency pair can produce multiple false signals or none at all. In any case, the flat trend is not the best condition for trading.
4) Trading activities are confined between the onset of the European session and mid-way through the U.S. session, after which all open trades should be manually closed.
5) On the 30-minute timeframe, trades based on MACD signals are only advisable amidst substantial volatility and an established trend, confirmed either by a trendline or trend channel.
6) If two levels lie closely together (ranging from 5 to 15 pips apart), they should be considered as a support or resistance zone.
Support and Resistance price levels can serve as targets when buying or selling. You can place Take Profit levels near them.
Red lines represent channels or trend lines, depicting the current market trend and indicating the preferable trading direction.
The MACD(14,22,3) indicator, encompassing both the histogram and signal line, acts as an auxiliary tool and can also be used as a signal source.
Significant speeches and reports (always noted in the news calendar) can profoundly influence the price dynamics. Hence, trading during their release calls for heightened caution. It may be reasonable to exit the market to prevent abrupt price reversals against the prevailing trend.
Beginning traders should always remember that not every trade will yield profit. Establishing a clear strategy coupled with sound money management is the cornerstone of sustained trading success.
*La presente analisi del mercato ha un carattere esclusivamente informativo e non rappresenta una guida per l`effettuazione di una transazione.
Le recensioni analitiche di InstaSpot ti renderanno pienamente consapevole delle tendenze del mercato! Essendo un cliente InstaSpot, ti viene fornito un gran numero di servizi gratuiti per il trading efficiente.


