


Nella nostra squadra ci sono più di 7.000.000 trader! Ogni giorno ci impegniamo a far sì che il trading migliori. Conseguiamo grandi risultati e ci muoviamo in avanti.
Il riconoscimento da parte di milioni di trader in tutto il mondo rappresenta l'alta valutazione della nostra attività! Voi avete fatto la vostra scelta e noi faremo la nostra al fine di soddisfare le vostre aspettative!
Assieme siamo una grande squadra!
InstaSpot. Siamo orgogliosi di lavorare per voi!


Attore, campione del mondo di lotta libera e semplicemente un vero maciste russo! Persona venuta dal nulla. Persona che rispecchia i nostri obiettivi. Il segreto del successo di Taktarov consiste nel mirare continuamente al suo scopo.
Dischiudi anche tu tutti gli aspetti del tuo talento! Impara, prova, sbaglia, ma non fermarti!
InstaSpot - la storia delle tue vittorie inizia qui!

The EUR/USD continued to trade flat as low volatility persists. If a week or two ago, the price was within the range of 1.0670-1.0755, it has now turned into 1.0678-1.0726. Trades on Wednesday, Thursday, and Friday took place within this range. It is worth pointing out that the US released some economic reports on Thursday and Friday. Therefore, the pair could have shown more significant movements on those days. However, as is often the case, the market solved the riddle in its own way and did not find anything interesting in the US reports.
At the beginning of the week, we warned traders that although these US reports seems significant in its own way, they remain of secondary importance. GDP reports rarely provoke a market reaction, and durable goods orders reports only provoke a reaction in the event of a significant deviation from the forecasts. The remaining reports had even fewer chances of fueling market movement. In the end, we didn't see anything interesting.
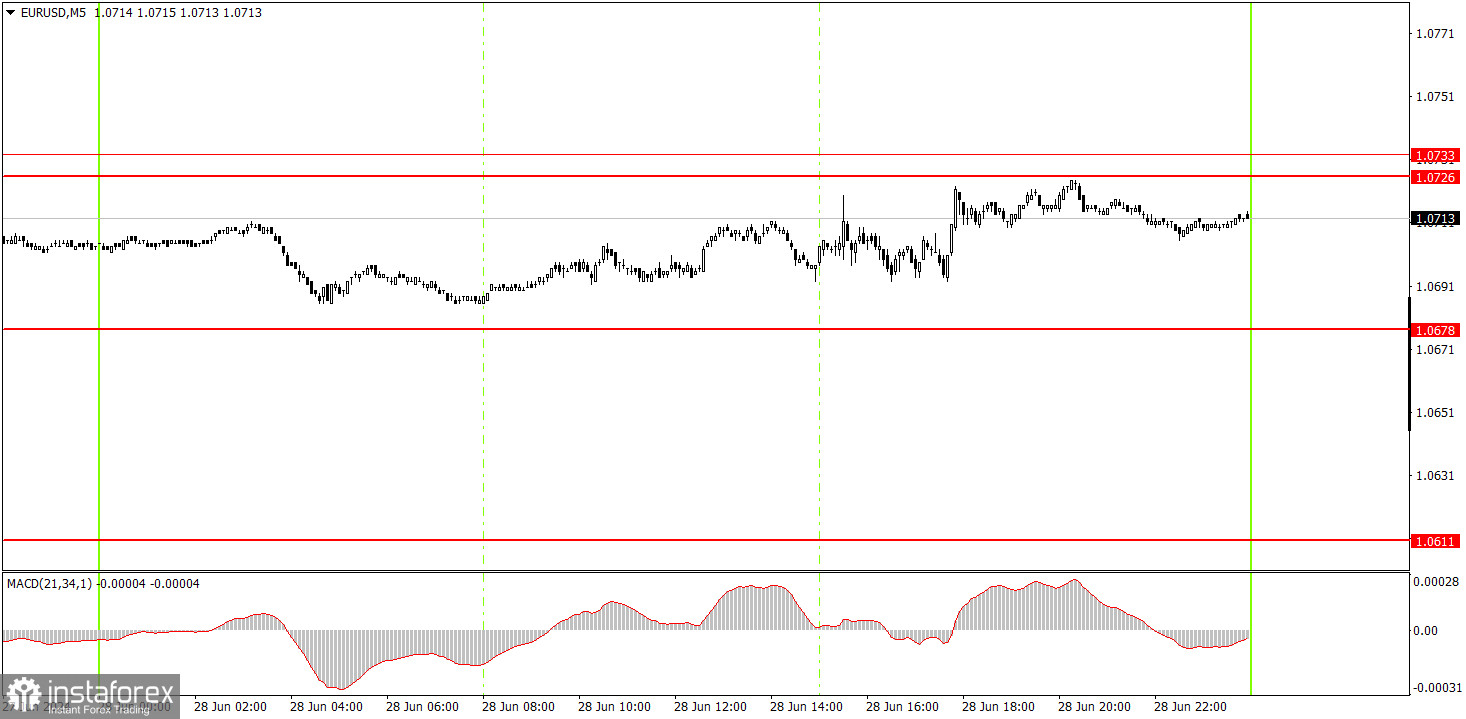
On the 5-minute timeframe, volatility was less than 50 pips and EUR/USD was unable to form any trading signals during the day. Traders could consider long positions around the 1.0678 level, as the pair could not breach this mark even after three attempts, also as I mentioned before, there were no signals. By the end of the day, the price approached the upper boundary of the horizontal channel, but opening a trade just before the market closes is not the best decision.
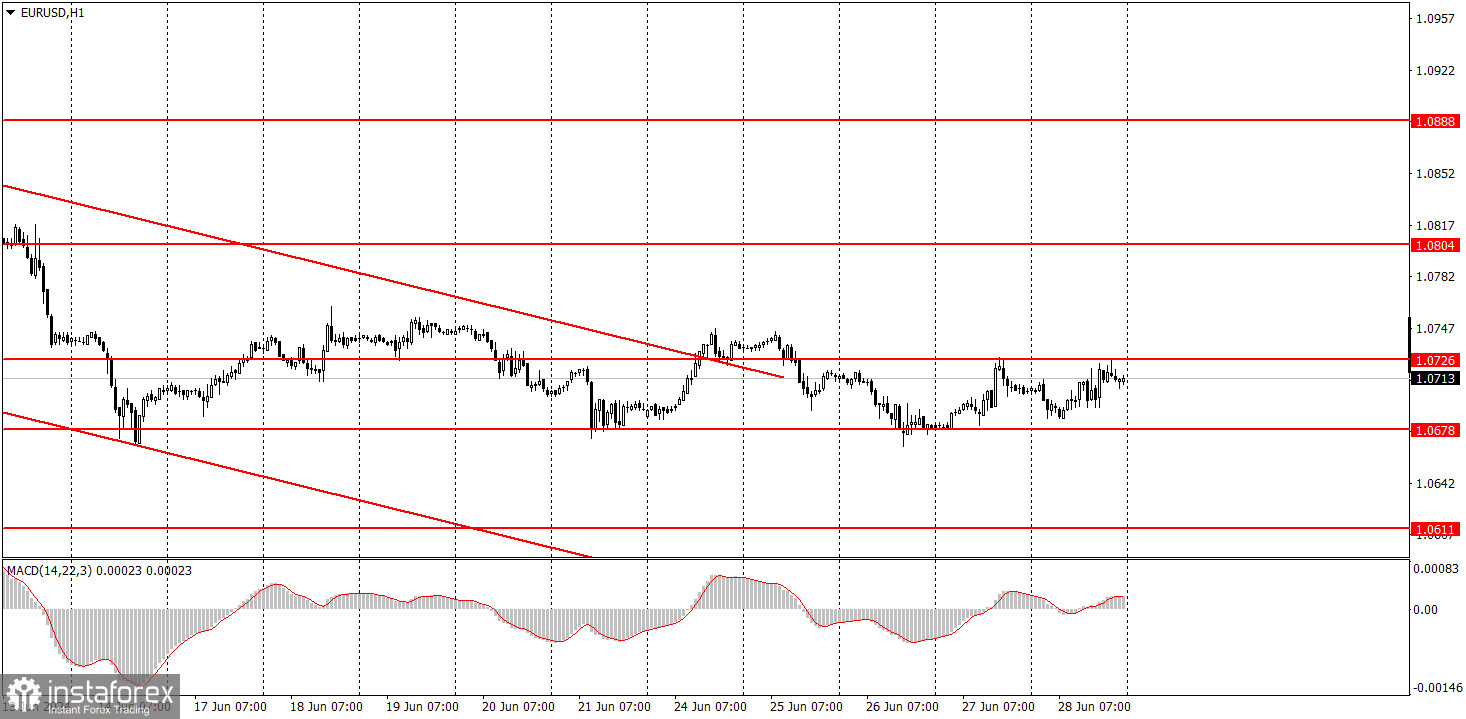
On the hourly chart, EUR/USD has started to form a local downward trend, but the pair is currently going through a correction and trading within a horizontal channel. We still expect the pair to drop to levels like 1.0600, 1.0450, and even 1.0200. However, it's important to understand that the price will not reach these targets immediately; they are medium-term objectives. For instance, the pair could go through a corrective phase for another week, as the price has not breached the level of 1.0678 even after three attempts. Nonetheless, we don't see any reasons for the euro to rise in the medium-term.
On Monday, traders can expect the downward movement to continue if the price breaks through the level of 1.0678. However, it's important to remember that EUR/USD may show weak, erratic and even sideways movements.
The key levels on the 5M chart are 1.0483, 1.0526, 1.0568, 1.0611, 1.0678, 1.0726-1.0733, 1.0797-1.0804, 1.0838-1.0856, 1.0888-1.0896, 1.0940, 1.0971-1.0981. On Monday, Germany will post its inflation report. Business activity indices will be published in the Eurozone and the US, and as a bonus, European Central Bank President Christine Lagarde will speak. The upcoming week should put an end to the local flat.
1) Signal strength is determined by the time taken for its formation (either a bounce or level breach). A shorter formation time indicates a stronger signal.
2) If two or more trades around a certain level are initiated based on false signals, subsequent signals from that level should be disregarded.
3) In a flat market, any currency pair can produce multiple false signals or none at all. In any case, the flat trend is not the best condition for trading.
4) Trading activities are confined between the onset of the European session and mid-way through the U.S. session, after which all open trades should be manually closed.
5) On the 30-minute timeframe, trades based on MACD signals are only advisable amidst substantial volatility and an established trend, confirmed either by a trendline or trend channel.
6) If two levels lie closely together (ranging from 5 to 15 pips apart), they should be considered as a support or resistance zone.
Support and Resistance price levels can serve as targets when buying or selling. You can place Take Profit levels near them.
Red lines represent channels or trend lines, depicting the current market trend and indicating the preferable trading direction.
The MACD(14,22,3) indicator, encompassing both the histogram and signal line, acts as an auxiliary tool and can also be used as a signal source.
Significant speeches and reports (always noted in the news calendar) can profoundly influence the price dynamics. Hence, trading during their release calls for heightened caution. It may be reasonable to exit the market to prevent abrupt price reversals against the prevailing trend.
Beginners should always remember that not every trade will yield profit. Establishing a clear strategy coupled with sound money management is the cornerstone of sustained trading success.
*La presente analisi del mercato ha un carattere esclusivamente informativo e non rappresenta una guida per l`effettuazione di una transazione.
Le recensioni analitiche di InstaSpot ti renderanno pienamente consapevole delle tendenze del mercato! Essendo un cliente InstaSpot, ti viene fornito un gran numero di servizi gratuiti per il trading efficiente.


