


Nella nostra squadra ci sono più di 7.000.000 trader! Ogni giorno ci impegniamo a far sì che il trading migliori. Conseguiamo grandi risultati e ci muoviamo in avanti.
Il riconoscimento da parte di milioni di trader in tutto il mondo rappresenta l'alta valutazione della nostra attività! Voi avete fatto la vostra scelta e noi faremo la nostra al fine di soddisfare le vostre aspettative!
Assieme siamo una grande squadra!
InstaSpot. Siamo orgogliosi di lavorare per voi!


Attore, campione del mondo di lotta libera e semplicemente un vero maciste russo! Persona venuta dal nulla. Persona che rispecchia i nostri obiettivi. Il segreto del successo di Taktarov consiste nel mirare continuamente al suo scopo.
Dischiudi anche tu tutti gli aspetti del tuo talento! Impara, prova, sbaglia, ma non fermarti!
InstaSpot - la storia delle tue vittorie inizia qui!

Despite strong macro data and a speech by European Central Bank President Christine Lagarde, EUR/USD only managed to go through 43 pips of volatility. And this amount of volatility was demonstrated within five minutes when the NonFarm Payrolls and unemployment reports were published in the US. Both reports turned out to be weaker than forecasts, which could have triggered a new decline in the greenback. Overall, the dollar did decline, but the overall intraday volatility, as before, left much to be desired. We constantly bring up the fact that the pair shows very weak movements, as this is the main point at the moment. Therefore, we can draw two conclusions. First, even trades on the 5-minute timeframe can be kept open for 2-3 days. Second, it is extremely difficult to count on high profits right now, and the pair may not even form signals every day, although we are talking about the smallest timeframe.
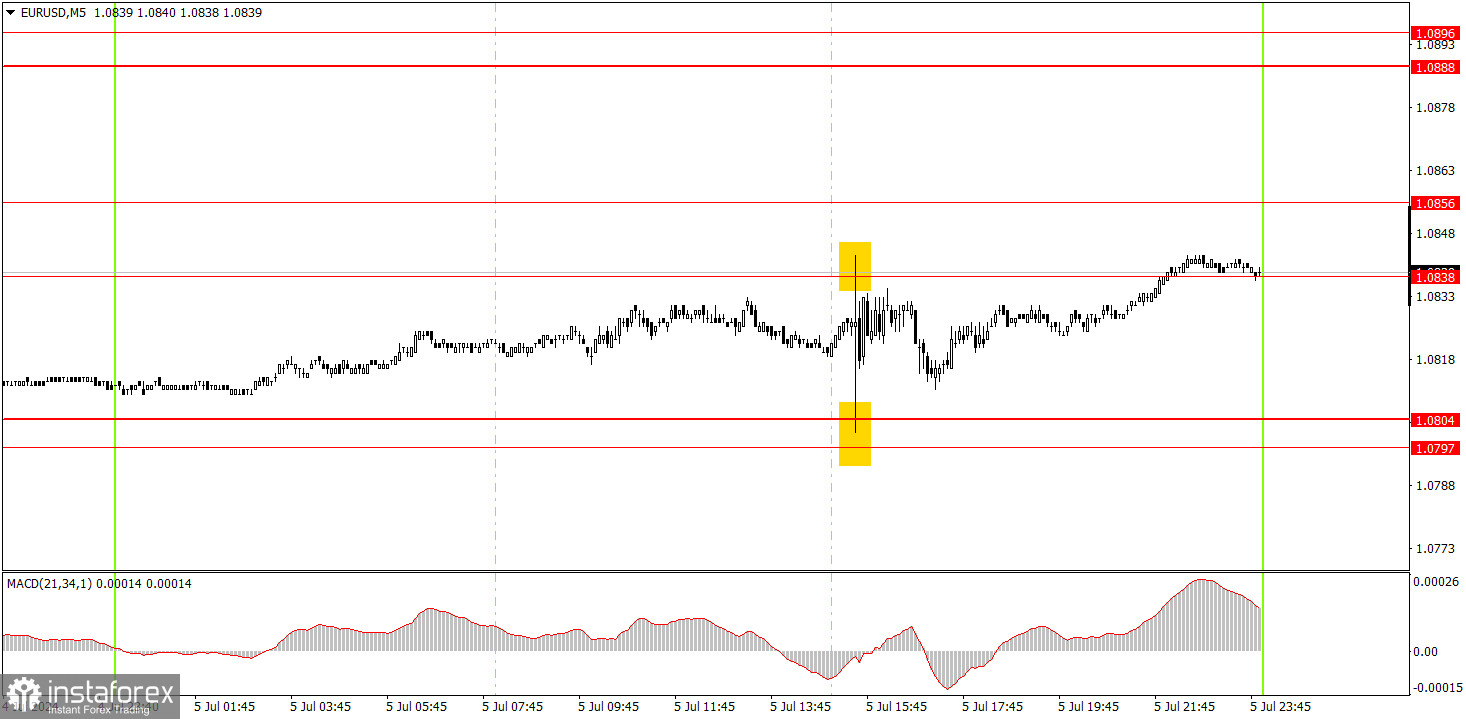
Two trading signals were formed on the 5-minute timeframe, and it made no sense to execute either of them. The pair formed both signals during the release of key US data, so it was very difficult to open at least one trade. Not to mention that the signals formed within 5 minutes and were pointing in different directions. In any case, it was simply dangerous to enter the market before the release of the NonFarms and unemployment data. The only option was to remain in long positions from Thursday when the price overcame the area of 1.0797-1.0804.
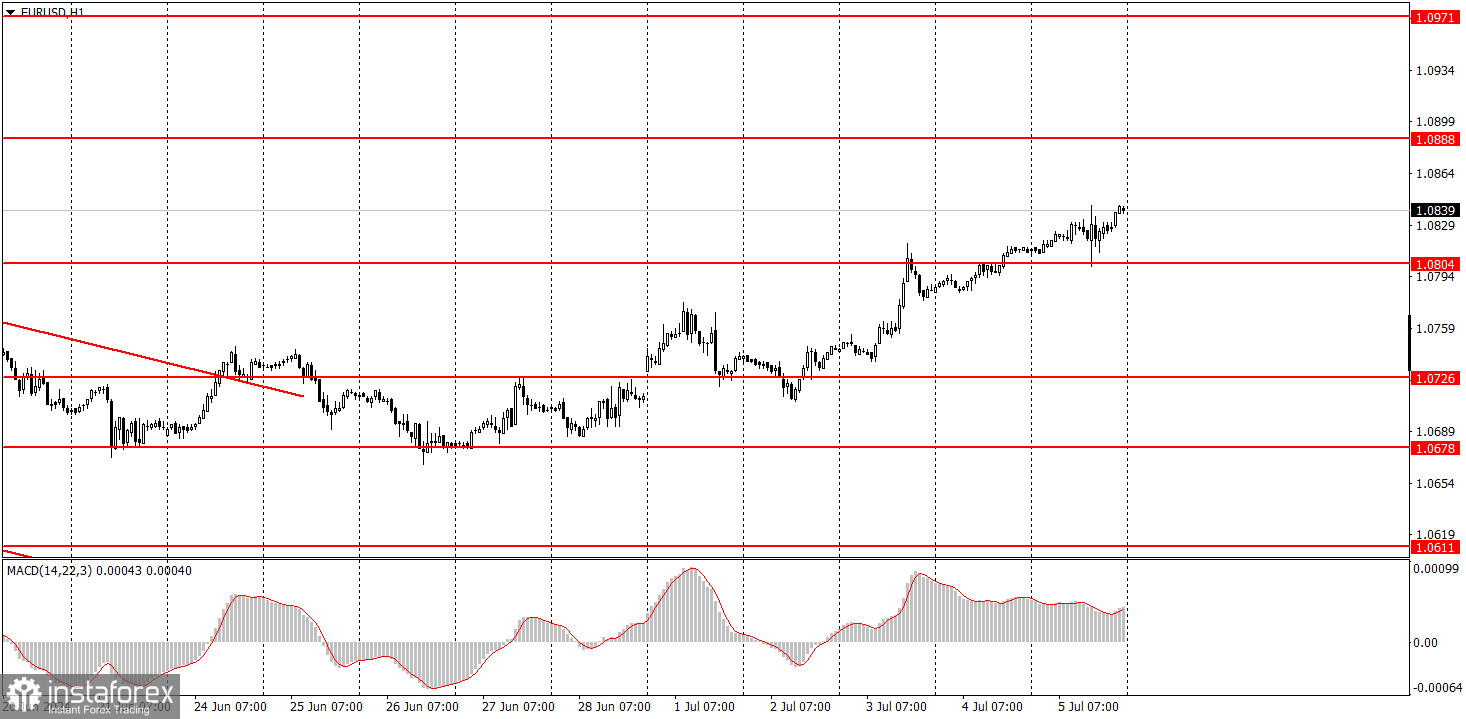
On the hourly chart, EUR/USD was unable to break through the 1.0678 level, and the latest economic reports have mostly supported the euro rather than the dollar. Therefore, we saw a fairly consistent rise in the euro. The general (downward) trend has not changed, but the euro has been frequently trading with strong corrections over the past 7-8 months. Formally, the euro is in a downtrend, as seen on the higher timeframes, but the process of the pair's decline in the medium-term has been extremely slow.
On Monday, beginners can trade from the 1.0838-1.0856 area. However, please note that the pair may experience very low volatility.
The key levels on the 5M chart are 1.0483, 1.0526, 1.0568, 1.0611, 1.0678, 1.0726-1.0733, 1.0797-1.0804, 1.0838-1.0856, 1.0888-1.0896, 1.0940, 1.0971-1.0981. For Monday, no important events are scheduled in either the Eurozone or the US. Therefore, it is almost guaranteed that volatility will be extremely low.
1) Signal strength is determined by the time taken for its formation (either a bounce or level breach). A shorter formation time indicates a stronger signal.
2) If two or more trades around a certain level are initiated based on false signals, subsequent signals from that level should be disregarded.
3) In a flat market, any currency pair can produce multiple false signals or none at all. In any case, the flat trend is not the best condition for trading.
4) Trading activities are confined between the onset of the European session and mid-way through the U.S. session, after which all open trades should be manually closed.
5) On the 30-minute timeframe, trades based on MACD signals are only advisable amidst substantial volatility and an established trend, confirmed either by a trendline or trend channel.
6) If two levels lie closely together (ranging from 5 to 15 pips apart), they should be considered as a support or resistance zone.
Support and Resistance price levels can serve as targets when buying or selling. You can place Take Profit levels near them.
Red lines represent channels or trend lines, depicting the current market trend and indicating the preferable trading direction.
The MACD(14,22,3) indicator, encompassing both the histogram and signal line, acts as an auxiliary tool and can also be used as a signal source.
Significant speeches and reports (always noted in the news calendar) can profoundly influence the price dynamics. Hence, trading during their release calls for heightened caution. It may be reasonable to exit the market to prevent abrupt price reversals against the prevailing trend.
Beginners should always remember that not every trade will yield profit. Establishing a clear strategy coupled with sound money management is the cornerstone of sustained trading success.
*La presente analisi del mercato ha un carattere esclusivamente informativo e non rappresenta una guida per l`effettuazione di una transazione.
Le recensioni analitiche di InstaSpot ti renderanno pienamente consapevole delle tendenze del mercato! Essendo un cliente InstaSpot, ti viene fornito un gran numero di servizi gratuiti per il trading efficiente.


