


Nella nostra squadra ci sono più di 7.000.000 trader! Ogni giorno ci impegniamo a far sì che il trading migliori. Conseguiamo grandi risultati e ci muoviamo in avanti.
Il riconoscimento da parte di milioni di trader in tutto il mondo rappresenta l'alta valutazione della nostra attività! Voi avete fatto la vostra scelta e noi faremo la nostra al fine di soddisfare le vostre aspettative!
Assieme siamo una grande squadra!
InstaSpot. Siamo orgogliosi di lavorare per voi!


Attore, campione del mondo di lotta libera e semplicemente un vero maciste russo! Persona venuta dal nulla. Persona che rispecchia i nostri obiettivi. Il segreto del successo di Taktarov consiste nel mirare continuamente al suo scopo.
Dischiudi anche tu tutti gli aspetti del tuo talento! Impara, prova, sbaglia, ma non fermarti!
InstaSpot - la storia delle tue vittorie inizia qui!

Last week, the S&P 500 fell by 2.95% from its record peak, forming a divergence with the Marlin oscillator on the weekly chart. Fibonacci rays indirectly confirm the peak and reversal. Our task is to determine the timing and depth of the ongoing correction.
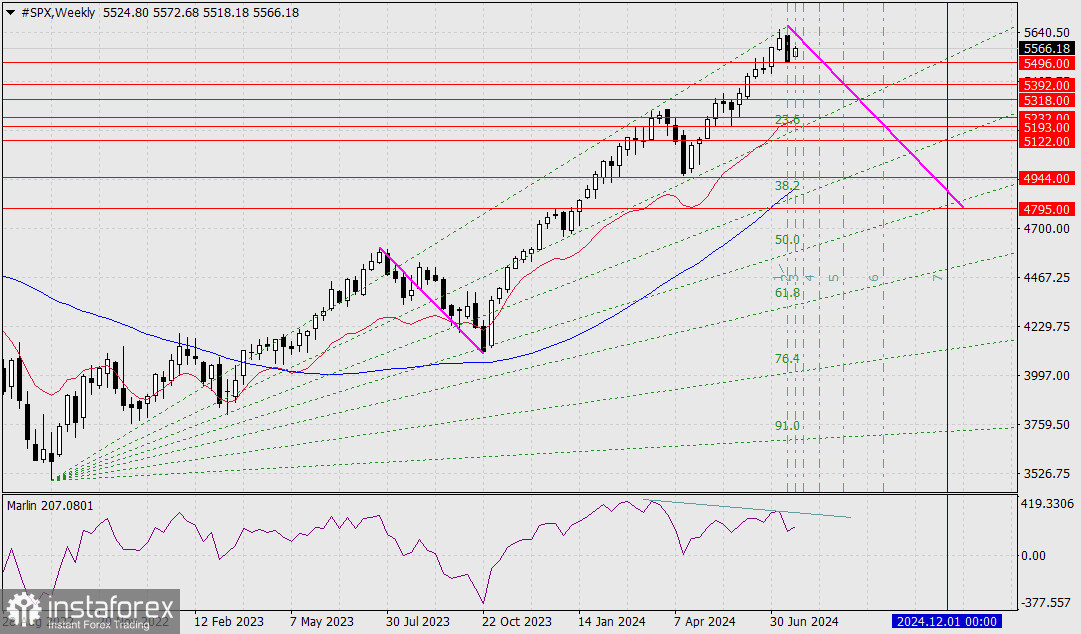
On the weekly chart, there is a magnetic point at the intersection of four lines: the 50% Fibonacci ray, the target level of 4795 – the peak of December 2023, the trendline from the July-October 2023 correction, and the Fibonacci timeline of order number 7. This gives us a timeframe of late November to early December of the current year. This period will coincide with the conclusion of the U.S. presidential elections and the announcement of the new president's plans, whoever that may be. Therefore, the index could hit new record highs when the S&P 500 falls 15.4% from its all-time high at 4795.
Intermediate targets on the way to 4795:
*La presente analisi del mercato ha un carattere esclusivamente informativo e non rappresenta una guida per l`effettuazione di una transazione.
Le recensioni analitiche di InstaSpot ti renderanno pienamente consapevole delle tendenze del mercato! Essendo un cliente InstaSpot, ti viene fornito un gran numero di servizi gratuiti per il trading efficiente.


