


Nella nostra squadra ci sono più di 7.000.000 trader! Ogni giorno ci impegniamo a far sì che il trading migliori. Conseguiamo grandi risultati e ci muoviamo in avanti.
Il riconoscimento da parte di milioni di trader in tutto il mondo rappresenta l'alta valutazione della nostra attività! Voi avete fatto la vostra scelta e noi faremo la nostra al fine di soddisfare le vostre aspettative!
Assieme siamo una grande squadra!
InstaSpot. Siamo orgogliosi di lavorare per voi!


Attore, campione del mondo di lotta libera e semplicemente un vero maciste russo! Persona venuta dal nulla. Persona che rispecchia i nostri obiettivi. Il segreto del successo di Taktarov consiste nel mirare continuamente al suo scopo.
Dischiudi anche tu tutti gli aspetti del tuo talento! Impara, prova, sbaglia, ma non fermarti!
InstaSpot - la storia delle tue vittorie inizia qui!

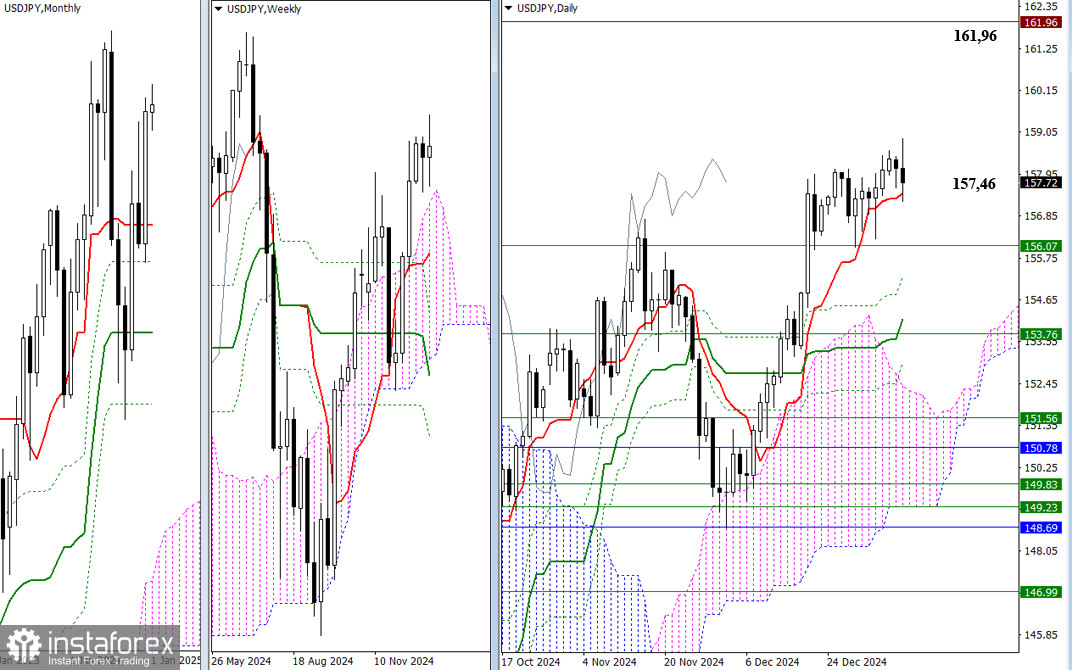
Last year, despite monthly fluctuations that included rises, declines, and recoveries, the market closed with an overall optimistic bullish candlestick, where the upper shadow was slightly longer than the lower shadow. Based on the yearly results, a renewal of the maximum extreme of 2024 at 161.96 could restore and continue the uptrend. This level now serves as the nearest and primary target for bullish traders.
If the bulls lose support at the daily short-term trend of 157.46, a corrective decline could gather momentum, shifting market focus to testing the next support levels of the Ichimoku daily golden cross (155.26, 154.13, and 153.01) with the goal of breaking and neutralizing these levels. At the same time, bearish traders may push into the weekly cloud at 156.07 and test the weekly short-term trend at 153.76.
***
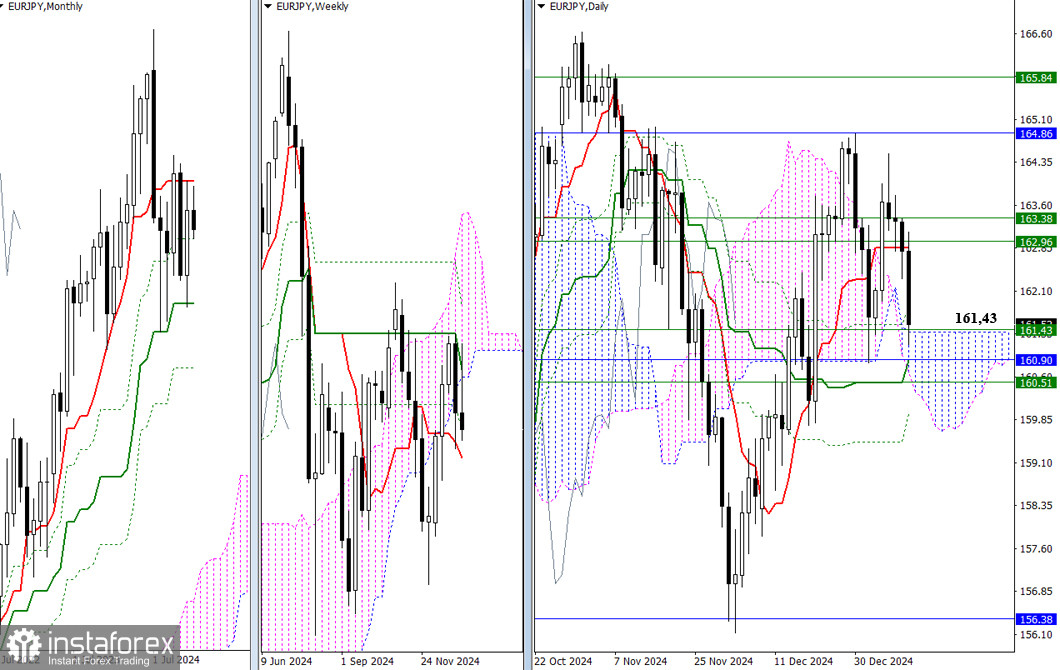
Last year, the pair left a relatively long upper shadow. In 2025, the focus will be on whether the bulls can overcome this shadow and continue the uptrend. Currently, the pair's position is uncertain, with no clear leader. The bears have a slight advantage at present but are encountering a wide support zone where any level could halt the decline and trigger a rebound.
The support zone (161.43 – 161.38 – 160.90 – 160.89 – 160.51 – 160.33 – 159.96) includes levels from various timeframes.
Similarly, the bulls face significant challenges with a resistance zone overhead (162.85 – 162.96 – 163.38 – 164.86 – 165.84), which comprises levels from multiple timeframes. If they can successfully overcome this resistance zone, the pair will be closer to the nearest maximum high at 166.63 and will meet the breakout target of the daily cloud. This scenario would be supported by a rebound from the current support level at 161.43.
***
*La presente analisi del mercato ha un carattere esclusivamente informativo e non rappresenta una guida per l`effettuazione di una transazione.
Le recensioni analitiche di InstaSpot ti renderanno pienamente consapevole delle tendenze del mercato! Essendo un cliente InstaSpot, ti viene fornito un gran numero di servizi gratuiti per il trading efficiente.


