Pattern effettivi

I pattern sono modelli grafici che forma il prezzo nel grafico. Secondo uno dei postulati dell'analisi tecnica, la storia (movimento dei prezzi) si ripete. Ciò significa che i movimenti dei prezzi sono spesso simili nelle stesse situazioni, il che rende possibile prevedere con maggiore probabilità ulteriore sviluppo della situazione.
I pattern pertinenti di InstaSpot è un servizio facile da usare che ti consente di conoscere gli ultimi cambiamenti del mercato e reagire agli eventi in tempo. Nel nostro servizio troverai sempre gli schemi più recenti e pertinenti su ogni coppia a qualunque ora.
Triple Bottom
was formed on 25.03 at 02:00:36 (UTC+0)
signal strength 3 of 5
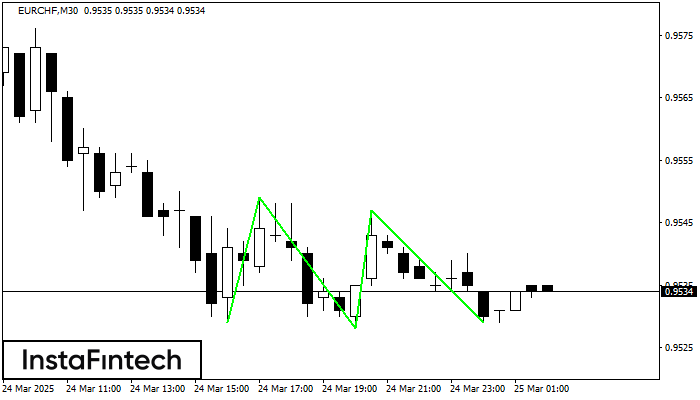
The Triple Bottom pattern has formed on the chart of the EURCHF M30 trading instrument. The pattern signals a change in the trend from downwards to upwards in the case of breakdown of 0.9549/0.9547.
Guardate inoltre
- All
- All
- Bullish Rectangle
- Bullish Symmetrical Triangle
- Bullish Symmetrical Triangle
- Double Bottom
- Double Top
- Double Top
- Triple Top
- Triple Top
- Triple Top
- Triple Top
- All
- All
- Buy
- Sale
- All
- 1
- 2
- 3
- 4
- 5
Bullischer Wimpel
was formed on 21.04 at 07:00:12 (UTC+0)
signal strength 3 of 5

Auf dem Chart M30 bildete NZDCAD das «Bullischer Wimpel» Muster. Diese Musterart stellt eine Trendfortsetzung dar. Die Wahrscheinlichkeit ist sehr hoch, dass der Ausbruch aus dem Wimpel 0.8293 zu einem
Open chart in a new window
Bullisches Rechteck
was formed on 21.04 at 06:10:19 (UTC+0)
signal strength 1 of 5

Auf dem Chart M5 bildete #Bitcoin das «Bullisches Rechteck» Muster. Dies ist das Muster einer Trendfortsetzung. Die untere Grenze des Musters liegt bei 87098.24; die obere bei 87617.56. Bei einem
Die М5 und М15 Timeframes können mehrere falsche Einstiegspunkte haben.
Open chart in a new window
Doppel-Boden
was formed on 21.04 at 06:05:07 (UTC+0)
signal strength 1 of 5

Auf dem Chart M5 bildete USDJPY das «Doppel-Boden» Muster. Diese Formation signalisiert eine Trendwende von unten nach oben. Signal: eine Kaufposition sollte nach dem Durchbruch der oberen Grenze des Musters
Die М5 und М15 Timeframes können mehrere falsche Einstiegspunkte haben.
Open chart in a new window