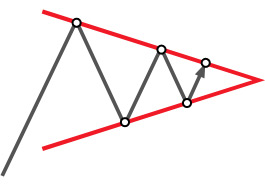
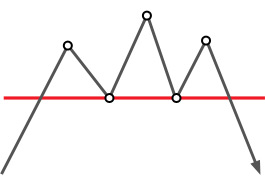
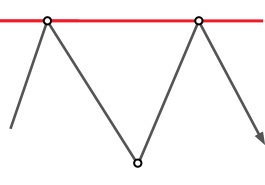
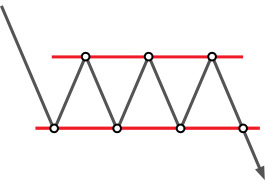
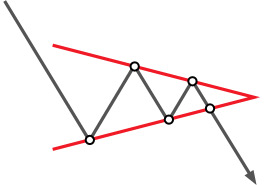
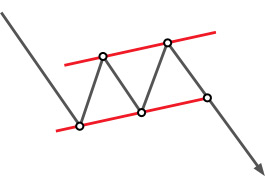
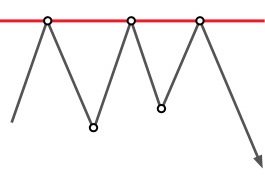
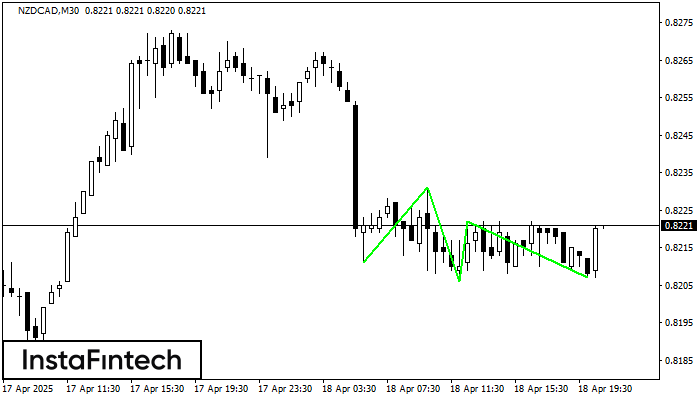
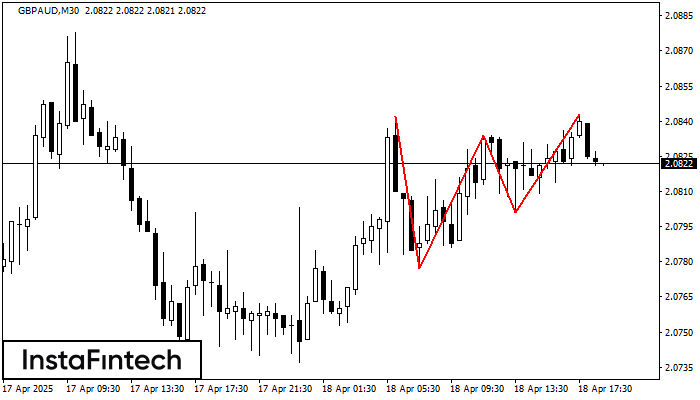
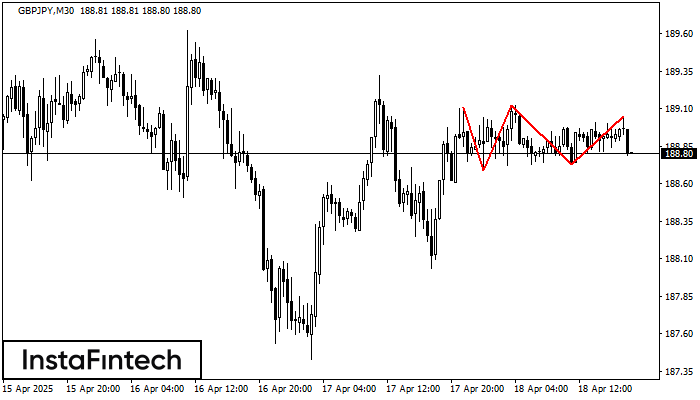
empty
it
Supporto
Apertura rapida di un conto
Piattaforma di trading
Ricaricare / Prelevare

Figures of technical analysis

Pennant

Technical analysis: Pennant

The Pennant pattern is a well-known pattern that is widely used in technical analysis. This figure is regularly found on trading charts of almost all currency pairs.
The development of Pennant on the trading chart indicate continuation of the trend.

Head and shoulders

Technical analysis: Head and shoulders

The "Head and Shoulders" pattern is primarily a reversal pattern. This pattern is formed on the basis of 3 tops or 3 bottoms, moreover the middle top(bottom) higher than the other two.

Double Top

Technical analysis: Double Top

The Double Top pattern is an easily recognizable reversal pattern. This pattern is usually formed near the resistance level and signals a situation on the market when the price fails to break the resistance line two times in a row.

Rectangle

Technical analysis: Rectangle

Rectangle - one of the most famous and simple methods of technical analysis in trade. Although it is easy to determine on the charts, this is an important and very strong figure, which is an indicator of the continuation of the trend. Due to the correct recognition of the rectangle, the trader can successfully enter the market.

Triangle

Technical analysis: Triangle

Triangles are among the most popular chart patterns used in technical analysis. This candlestick combination can be found on most financial instruments and on any time frame. Triangles fall under the category of continuation patterns, meaning that it is preceded by the trend, either bullish or bearish one.

Flag

Technical analysis: Flag

The flag is a model predicting the continuation of the trend. As well as other similar figures of trend continuation, it is formed after a rapid price movement and is similar to a slowdown. When the flat is completed, followed by a continuation of the trend, usually the same strong as the trend before.

Triple Top

Technical analysis: Triple Top

“Triple Top” è un modello d'inversione costituito da tre massimi uguali, seguito da una rottura del livello di supporto.

Actual patterns

Triplo Minimo
was formed on 18.04 at 20:00:30 (UTC+0)
signal strength 3 of 5

Triplo Minimo NZDCAD M30

Il modello Triplo Minimo si è formato sul grafico dello strumento di trading NZDCAD M30. Il modello segnala un cambiamento nel trend dal discendente all'ascendente in caso di rottura

Open chart in a new window

Triplo Massimo
was formed on 18.04 at 18:00:33 (UTC+0)
signal strength 3 of 5

Triplo Massimo GBPAUD M30

Il modello Triplo Massimo si è formato sul grafico del GBPAUD M30. Caratteristiche del modello: i confini hanno un angolo ascendente; la linea inferiore del modello ha le coordinate 2.0777/2.0801

Open chart in a new window

Triplo Massimo
was formed on 18.04 at 17:30:31 (UTC+0)
signal strength 3 of 5

Triplo Massimo GBPJPY M30

Sul grafico dello strumento di trading GBPJPY M30, si è formato il modello Triplo Massimo che segnala un cambiamento di trend. È possibile che dopo la formazione del terzo picco

Open chart in a new window
In questo momento non potete parlare al telefono?
Ponete la vostra domanda nella chat.