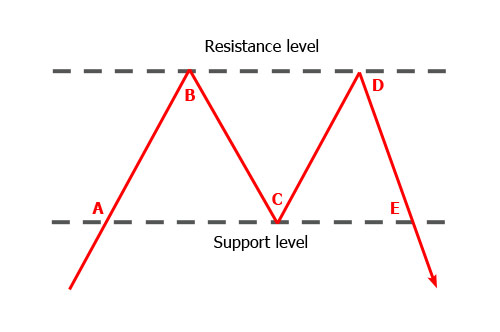
The Double Top pattern is an easily recognizable reversal pattern. This pattern is usually formed near the resistance level and signals a situation on the market when the price fails to break the resistance line two times in a row. Below you can see a picture of the Double Top pattern.
Importantly, the second top on the picture is slightly lower than the first one which is an obvious signal that the resistance level will not be broken and the price will surely reverse. Traders are better to enter the market when the price is located at the second top or at the level of the neck line.
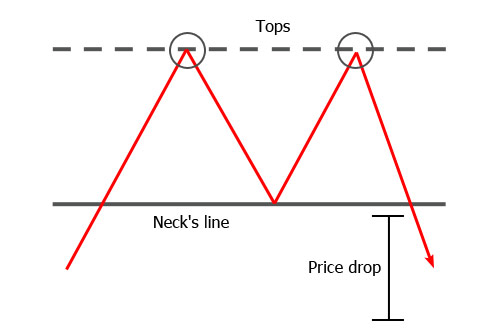
Let’s see what further developments we may see:
The amplitude of a decline usually equals the height of the Double Top pattern. Experienced traders say that these patterns are better to be found only after really strong trends. For example, in the sluggish sideways market such figures are of no importance. Moreover, such patterns are usually found on bigger time frames starting from 1 hour.
Actual patterns
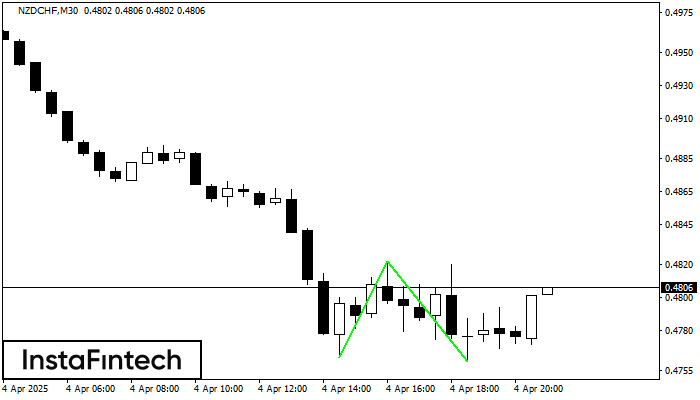
Doppio Minimo
was formed on 04.04 at 20:00:33 (UTC+0)
signal strength 3 of 5
Il modello Doppio Minimo è stato formato su NZDCHF M30. Questa formazione segnala un'inversione del trend dal discendente all'ascendente. Il segnale è che una posizione buy dovrebbe essere aperta dopo
Open chart in a new window
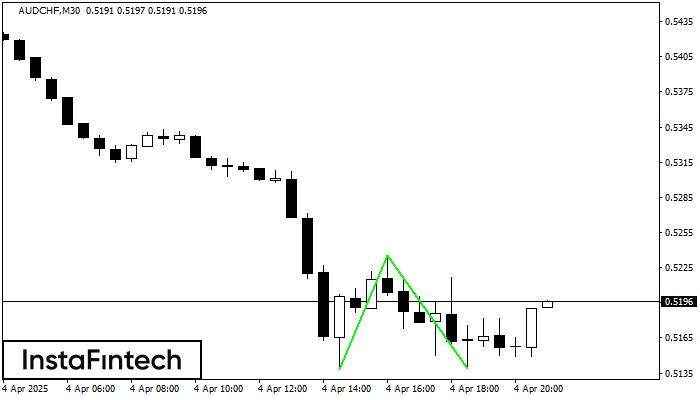
Doppio Minimo
was formed on 04.04 at 20:00:33 (UTC+0)
signal strength 3 of 5
Il modello Doppio Minimo è stato formato su AUDCHF M30; il confine superiore è 0.5235; il confine inferiore è 0.5139. La larghezza del modello è di 97 punti. In caso
Open chart in a new window
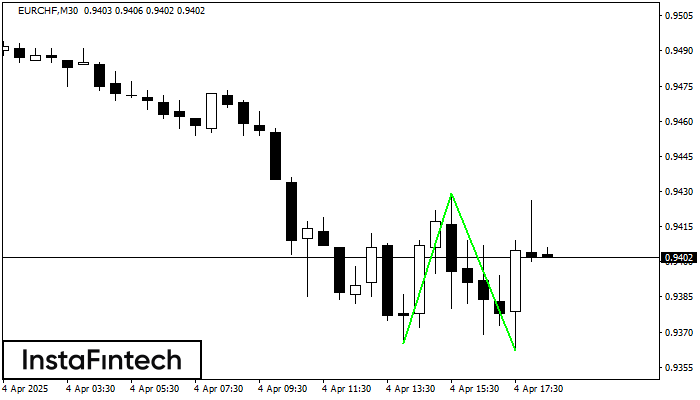
Doppio Minimo
was formed on 04.04 at 17:30:24 (UTC+0)
signal strength 3 of 5
Il modello Doppio Minimo è stato formato su EURCHF M30. Caratteristiche: il livello di supporto 0.9365; il livello di resistenza 0.9429; la larghezza del modello 64 punti. Se il livello
Open chart in a new window