- Analisis fundamental
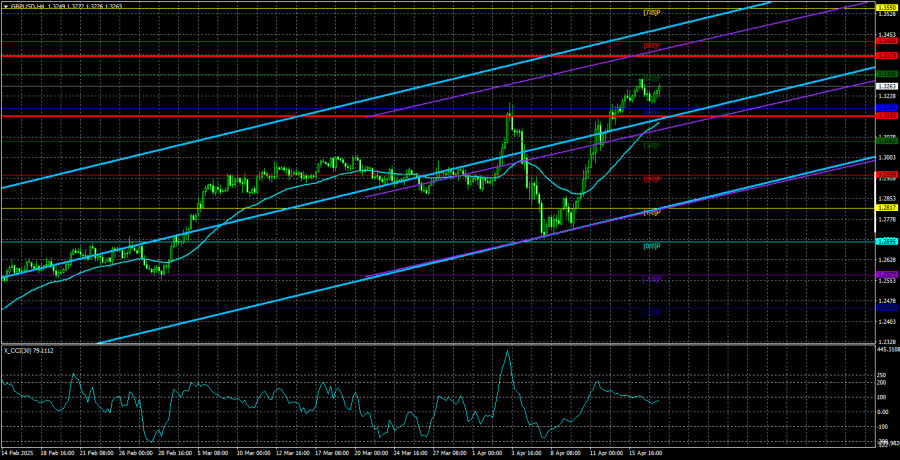
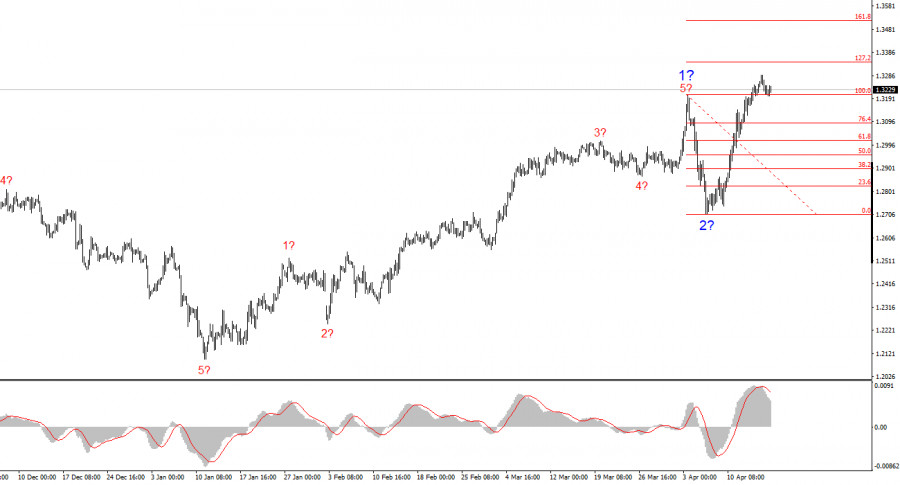
Gambaran Keseluruhan GBP/USD – 18 April. Ucapan Powell: Tiada Apa-apa yang Positif untuk Dolar
Pasangan mata wang GBP/USD terus berdagang secara relatif tenang pada hari Khamis, menunjukkan sedikit sahaja kecenderungan menurun. Kami masih tidak boleh mengklasifikasikan pergerakan semasa sebagai "penurunan semula" atau "pembetulan". CartaPengarang: Paolo Greco
03:48 2025-04-18 UTC+2
2
Pasangan GBP/USD kekal tidak berubah pada hari Khamis. Walaupun tingkah laku pasaran sedemikian mungkin dijangka pada hari Khamis, adalah mengejutkan tiada penurunan pada hari Rabu, melihat kepada bilangan faktor fundamentalPengarang: Chin Zhao
19:09 2025-04-17 UTC+2
4
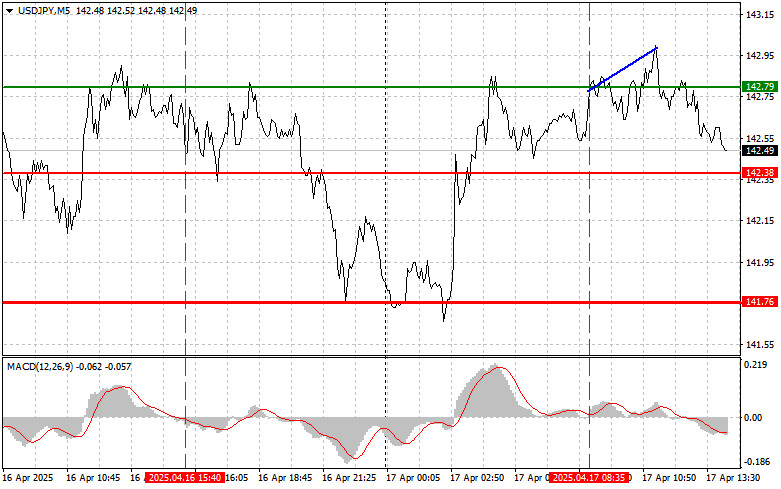
Ujian tahap 142.79 berlaku apabila indikator MACD baru sahaja mula bergerak ke atas dari tanda sifar, yang mengesahkan titik masuk yang sah untuk membeli dolar. Akibatnya, pasangan ini hanya naikPengarang: Jakub Novak
19:05 2025-04-17 UTC+2
3
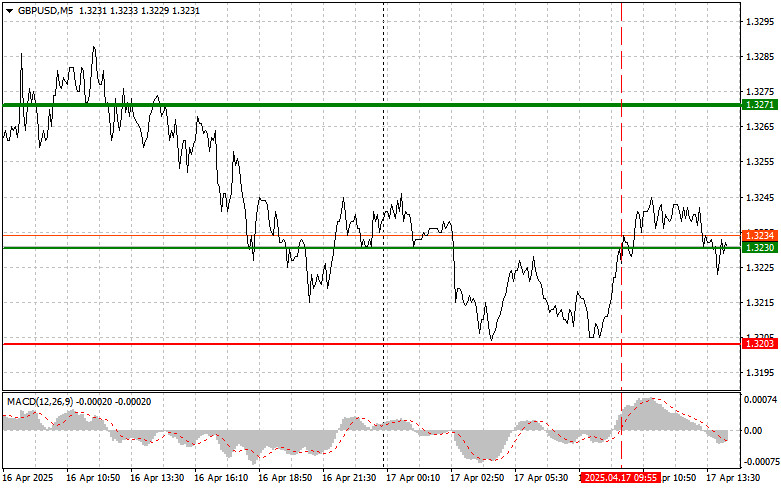
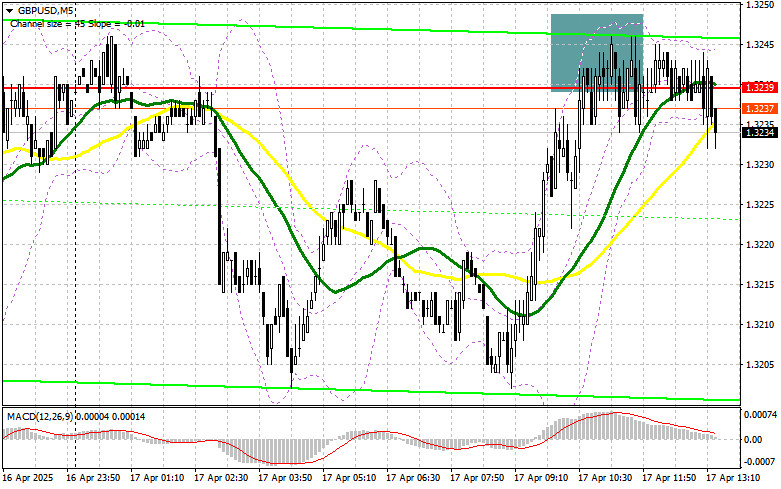
- Ujian pada tahap 1.3230 berlaku apabila penunjuk MACD sudah bergerak jauh di atas garis sifar, yang mengehadkan potensi kenaikan pound. Disebabkan ini, saya tidak melakukan pembelian. Tiada titik kemasukan lain
Pengarang: Jakub Novak
19:02 2025-04-17 UTC+2
2
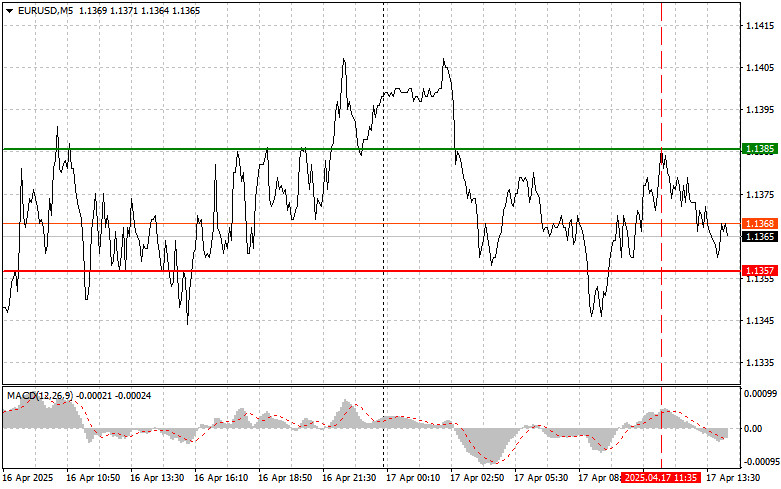
Ujian pada tahap 1.1385 berlaku ketika penunjuk MACD sudah bergerak jauh di atas tanda sifar, yang mengehadkan potensi kenaikan pasangan mata wang ini. Atas sebab ini, saya tidak membeli euroPengarang: Jakub Novak
18:57 2025-04-17 UTC+2
3
Dalam ramalan pagi saya, saya memberi tumpuan kepada tahap 1.3239 dan merancang untuk membuat keputusan kemasukan berdasarkan tahap tersebut. Mari kita lihat carta 5 minit dan lihat apa yang berlakuPengarang: Miroslaw Bawulski
18:53 2025-04-17 UTC+2
2
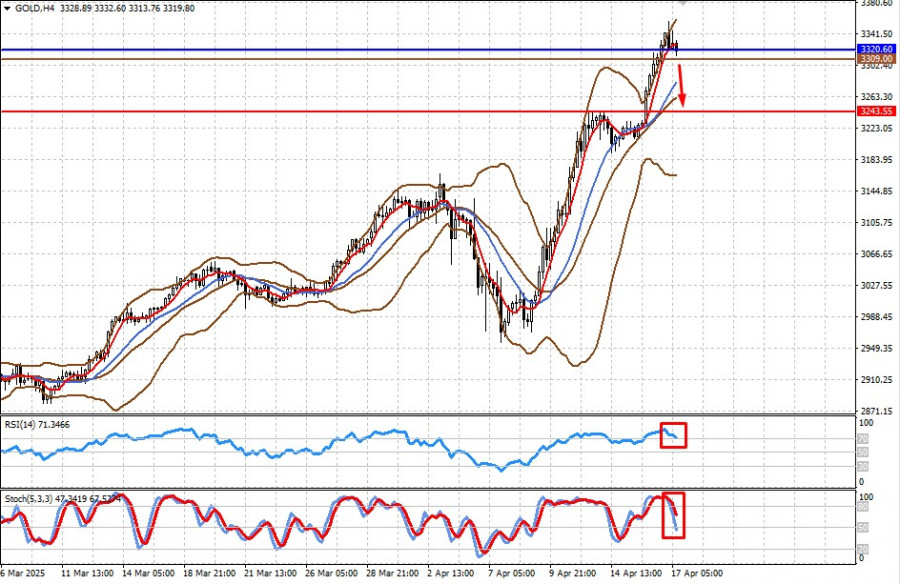
- Emas sedang mengalami penurunan pembetulan hari ini apabila peniaga mengambil keuntungan setelah ia naik baru-baru ini ke paras tertinggi sepanjang masa. Penurunan ini, walaupun sederhana, dipacu oleh beberapa faktor, termasuk
Pengarang: Irina Yanina
12:00 2025-04-17 UTC+2
18
berkenaan dengan perubahan mendatang dalam dasar monetari daripada Bank Pusat Eropah (ECB) dan Rizab Persekutuan A.S. (Fed). Penantian terhadap penurunan kadar sebanyak 25 mata asas oleh ECB—penurunan keenam berturut-turutPengarang: Irina Yanina
11:55 2025-04-17 UTC+2
9
Harga emas terus mendapat sokongan di tengah-tengah ketidakpastian yang menyelubungi hala tuju perang tarif yang dimulakan oleh Donald Trump. Harga emas telah meningkat hampir menegak selama empat bulan. Pendorong utamaPengarang: Pati Gani
11:49 2025-04-17 UTC+2
12


