


Legenda dalam pasukan InstaSpot!
Legenda! Anda fikir ia adalah satu retorik yang besar? Tetapi bagaimana untuk kita memanggil seorang lelaki, yang telah menjadi pemain Asia pertama yang memenangi kejohanan catur dunia junior pada usia 18 tahun dan menjadi Grandmaster India pertama pada usia 19 tahun? Itulah permulaan yang sukar untuk merangkul gelaran Juara Dunia untuk Viswanathan Anand, seorang juara yang telah menjadi sebahagian daripada sejarah catur. Kini satu lagi legenda dalam pasukan InstaSpot!


Borussia adalah salah satu kelab bola sepak paling terkemuka di Jerman, yang telah berulang kali membuktikan kepada peminatnya: semangat persaingan dan kepemimpinan pasti akan membawa kepada kejayaan. Berdagang dengan cara yang sama seperti atlet sukan profesional beraksi menentang lawan: yakin dan aktif. Simpan "hantaran" dari Borussia FC dan menjadi pedagang hebat dengan InstaSpot!

Trend-following analysis (picture 1)
This week, from the level of 1.0761 (the closing level of the last weekly candle), the instrument may begin a pullback movement downwards with a target of 1.0746, the Fibonacci level of 38.2% plotted by the red dotted line. When testing this level, the price may continue to move up with a target of 1.0835, the retracement level of 61.8% plotted by the red dotted line.
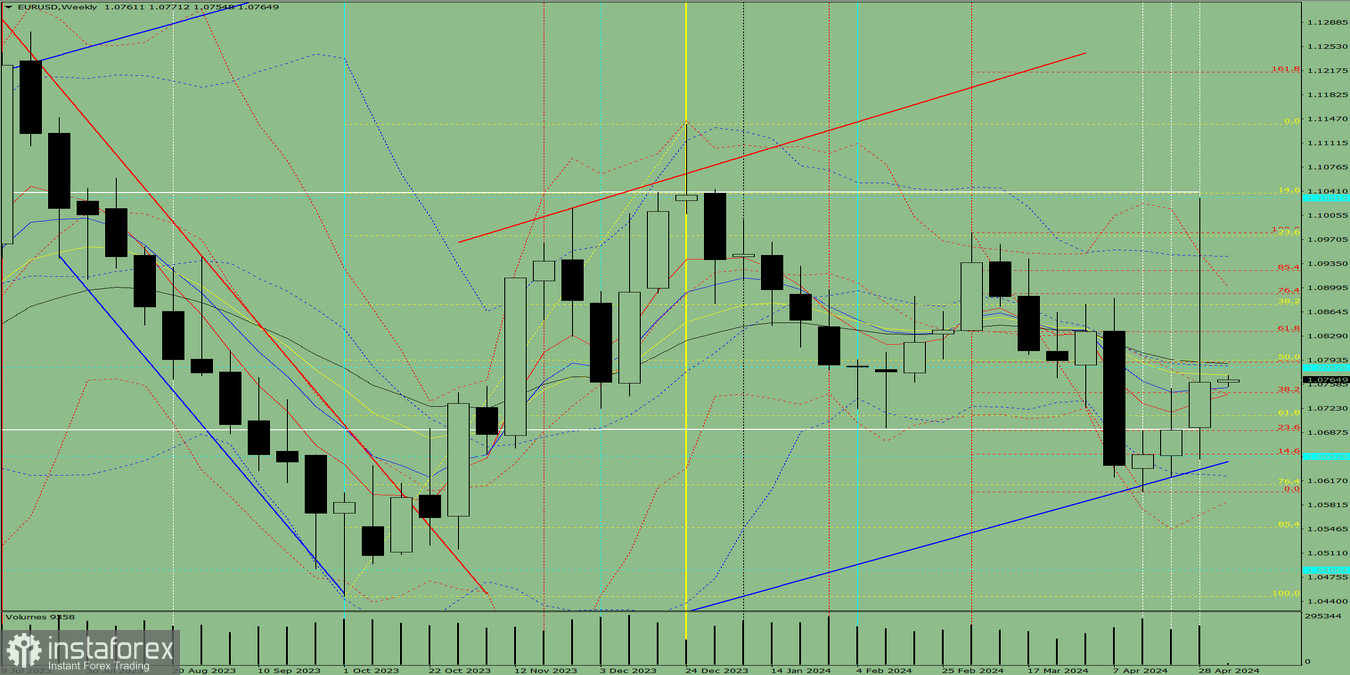
Picture 1: one-week chart
Complex analysis
Indicator analysis – up
Fibonacci levels – up
Trading volume – up
Candlestick analysis – down
Trend-following analysis – up
Bollinger bands – down
One-month chart – up
The conclusion from the complex analysis is an upward movement.
The result of evaluating the candlestick of the EUR/USD pair on the one-week chart: the price will most likely follow an upward trend during the week. This scenario is realistic due to the presence of the first lower shadow of the weekly white candle (Monday - down) and the absence of the second upper shadow (Friday - up).
This week, from 1.0761 (the close of the last weekly candle), EUR/USD may begin to move downward with a target of 1.0746, the retracement level of 38.2% plotted by the red dotted line. When testing this level, the price may continue to move up with a target of 1.0835, the retracement level of 61.8% plotted by the red dotted line.
An alternative scenario: from the level of 1.0761 (the closing level of the last weekly candle), the instrument can begin a pullback movement downwards with a target of 1.0712, the pullback level of 61.8% plotted by the yellow dotted line. When testing this level, the price may continue to move up with a target of 1.0835, the Fibonacci retracement level of 61.8% plotted by the red dotted line.
* Analisis pasaran yang disiarkan di sini adalah bertujuan untuk meningkatkan kesedaran anda, tetapi tidak untuk memberi arahan untuk membuat perdagangan.
Kajian analisis InstaSpot akan membuat anda mengetahui sepenuhnya aliran pasaran! Sebagai pelanggan InstaSpot, anda disediakan sejumlah besar perkhidmatan percuma untuk dagangan yang cekap.


