


Kumpulan kami mempunyai lebih daripada 7,000,000 pedagang!
Setiap hari kami bekerjasama untuk meningkatkan perdagangan. Kami mendapat keputusan yang tinggi dan bergerak ke hadapan.
Pengiktirafan oleh berjuta-juta pedagang di seluruh dunia adalah penghargaan terbaik untuk kerja kami! Anda membuat pilihan anda dan kami akan melakukan segalanya yang diperlukan untuk memenuhi jangkaan anda!
Kami adalah kumpulan yang terbaik bersama!
InstaSpot. Berbangga bekerja untuk anda!


Pelakon, juara kejohanan UFC 6 dan seorang wira sebenar!
Lelaki yang membuat dirinya sendiri. Lelaki yang mengikut cara kami.
Rahsia di sebalik kejayaan Taktarov adalah pergerakan berterusan ke arah matlamat.
Dedahkan semua segi bakat anda!
Cari, cuba, gagal - tetapi tidak pernah berhenti!
InstaSpot. Kisah kejayaan anda bermula di sini!

EUR/USD
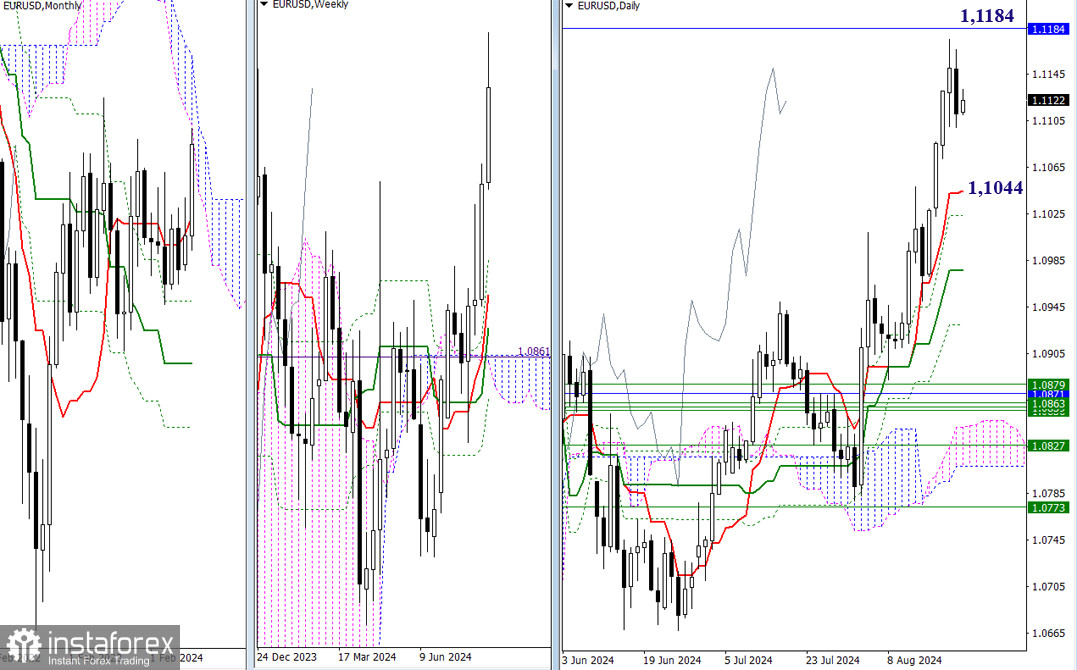
Higher time frames
Even though the pair did not directly reach the lower boundary of the monthly cloud (1.1184), the strength of the monthly resistance still contributed to a slowdown and the emergence of a downward correction on the daily time frame. As a result, for bulls, the key level for further advancement remains the 1.1184 mark. Conversely, for bears, it is important to continue developing the downward movement, with primary support levels to watch being the supports of the daily Ichimoku golden cross (1.1044 – 1.1023 – 1.0977 – 1.0930).
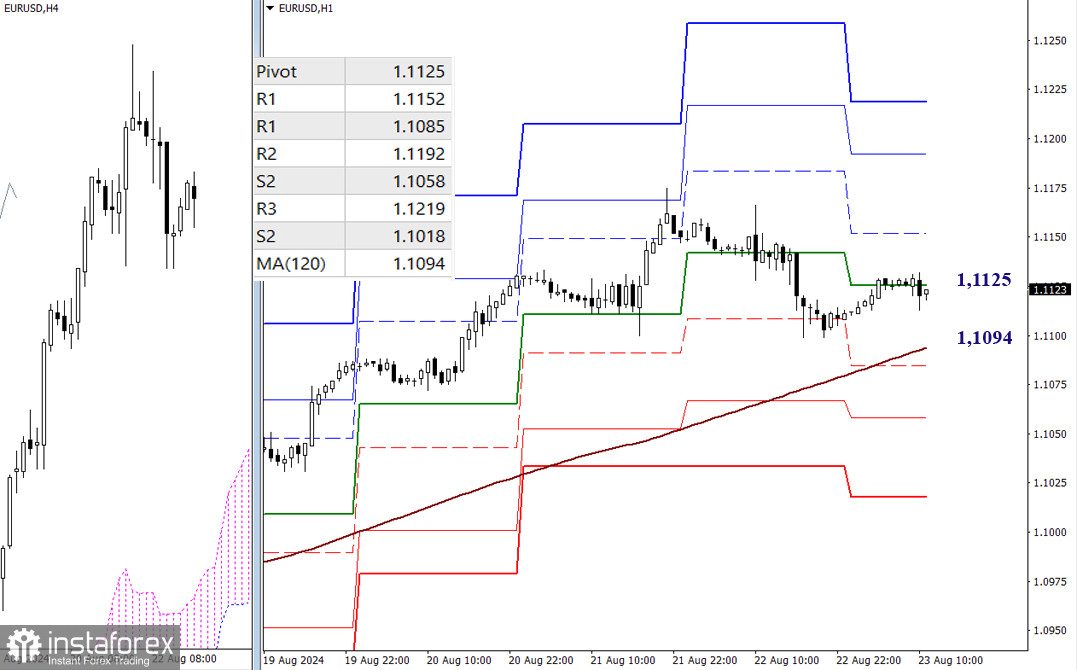
H4 – H1
Bullish traders continue to hold the upper hand in lower time frames. However, a decline is observed, and the pair trades within a corrective zone. Currently, the market is near the central pivot level (1.1125). If the movement turns towards developing bullish sentiment, the intraday resistances of the classic pivot levels (1.1152 – 1.1192 – 1.1219) may come into play. Conversely, if bearish sentiment strengthens, the bears will need to break through the support of the weekly long-term trend (1.1094), after which they will face interactions with the support levels of the classic Pivots (1.1085 – 1.1058 – 1.1018).
***
GBP/USD
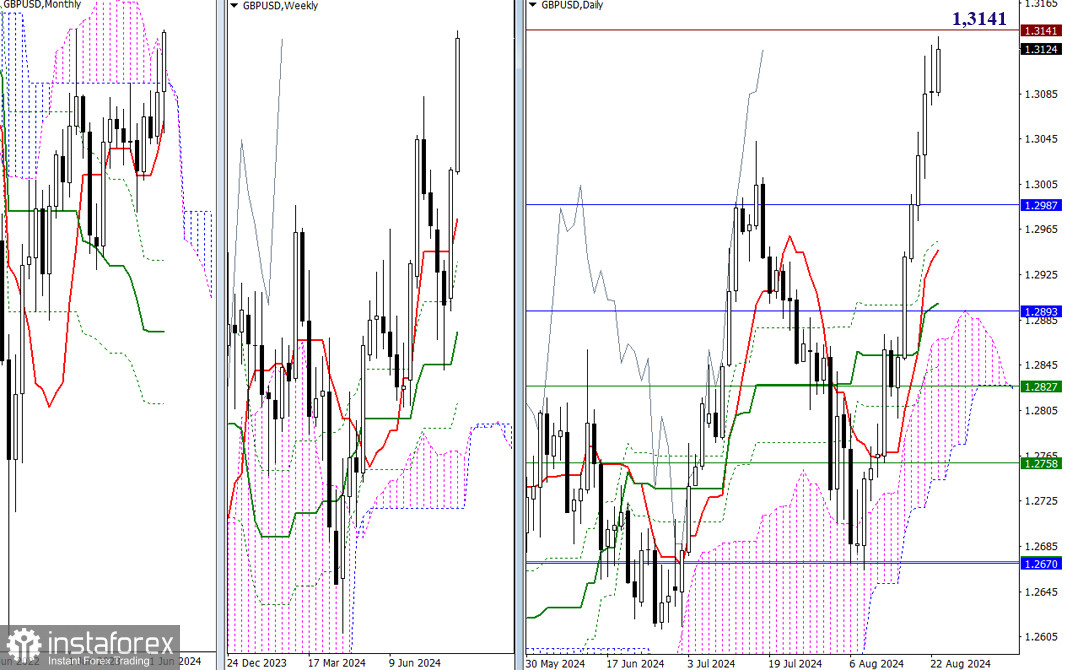
Higher time frames
The pair has again tested the nearest daily high and is close to testing the 2023 high (1.3141). The outcome of this interaction may determine the potential for further developments. A breakout would lead to new opportunities for the bulls. Conversely, a rejection would result in another halt in the development of bullish sentiment and become the basis for the pair to return to the influence zone of the Ichimoku monthly cloud, whose upper boundary is currently at the level of 1.2987.
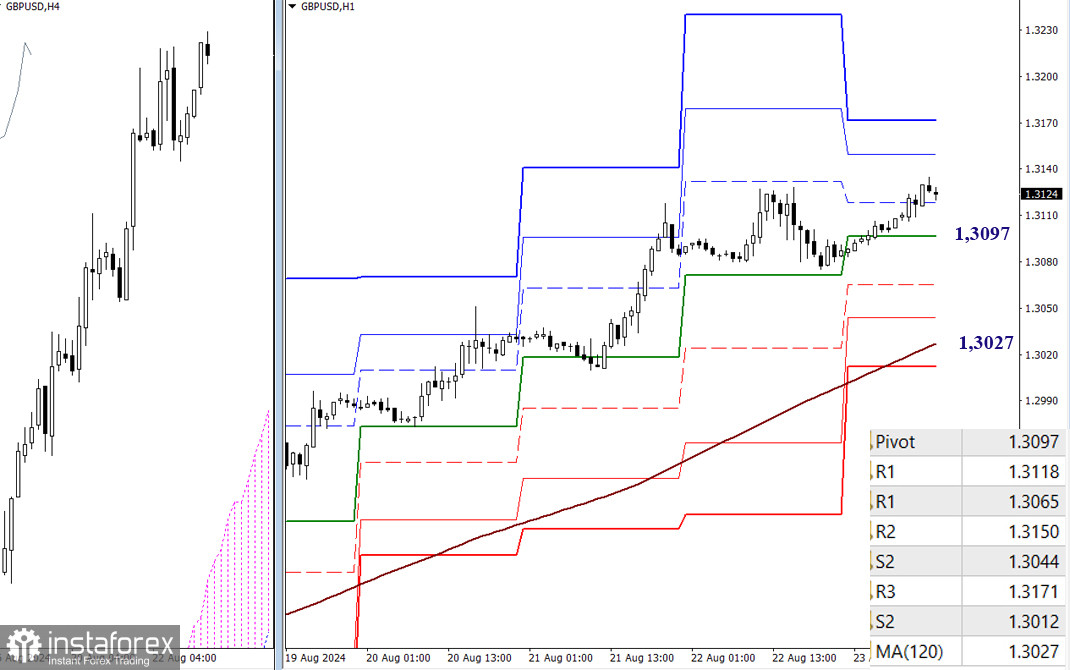
H4 – H1
Bullish traders hold the advantage on lower time frames as well. They are driving the rise, overcoming obstacles in the lower time frames, such as the resistance levels of the classic pivot points (1.3118 – 1.3150 – 1.3171). Key levels in the current situation serve as main reference points in case of a bearish correction. Today, these levels are at 1.3097 (central pivot point of the day) and 1.3027 (weekly long-term trend). The classic pivot point levels (1.3065 – 1.3044) may provide intermediate support levels on the way down to the trend.
***
This technical analysis is based on the following ideas:
Larger time frames - Ichimoku Kinko Hyo (9.26.52) + Fibo Kijun levels
H1 – classic pivot points + 120-period Moving Average (weekly long-term trendline)
* Analisis pasaran yang disiarkan di sini adalah bertujuan untuk meningkatkan kesedaran anda, tetapi tidak untuk memberi arahan untuk membuat perdagangan.
Kajian analisis InstaSpot akan membuat anda mengetahui sepenuhnya aliran pasaran! Sebagai pelanggan InstaSpot, anda disediakan sejumlah besar perkhidmatan percuma untuk dagangan yang cekap.


