

Kumpulan kami mempunyai lebih daripada 7,000,000 pedagang!
Setiap hari kami bekerjasama untuk meningkatkan perdagangan. Kami mendapat keputusan yang tinggi dan bergerak ke hadapan.
Pengiktirafan oleh berjuta-juta pedagang di seluruh dunia adalah penghargaan terbaik untuk kerja kami! Anda membuat pilihan anda dan kami akan melakukan segalanya yang diperlukan untuk memenuhi jangkaan anda!
Kami adalah kumpulan yang terbaik bersama!
InstaSpot. Berbangga bekerja untuk anda!


Pelakon, juara kejohanan UFC 6 dan seorang wira sebenar!
Lelaki yang membuat dirinya sendiri. Lelaki yang mengikut cara kami.
Rahsia di sebalik kejayaan Taktarov adalah pergerakan berterusan ke arah matlamat.
Dedahkan semua segi bakat anda!
Cari, cuba, gagal - tetapi tidak pernah berhenti!
InstaSpot. Kisah kejayaan anda bermula di sini!


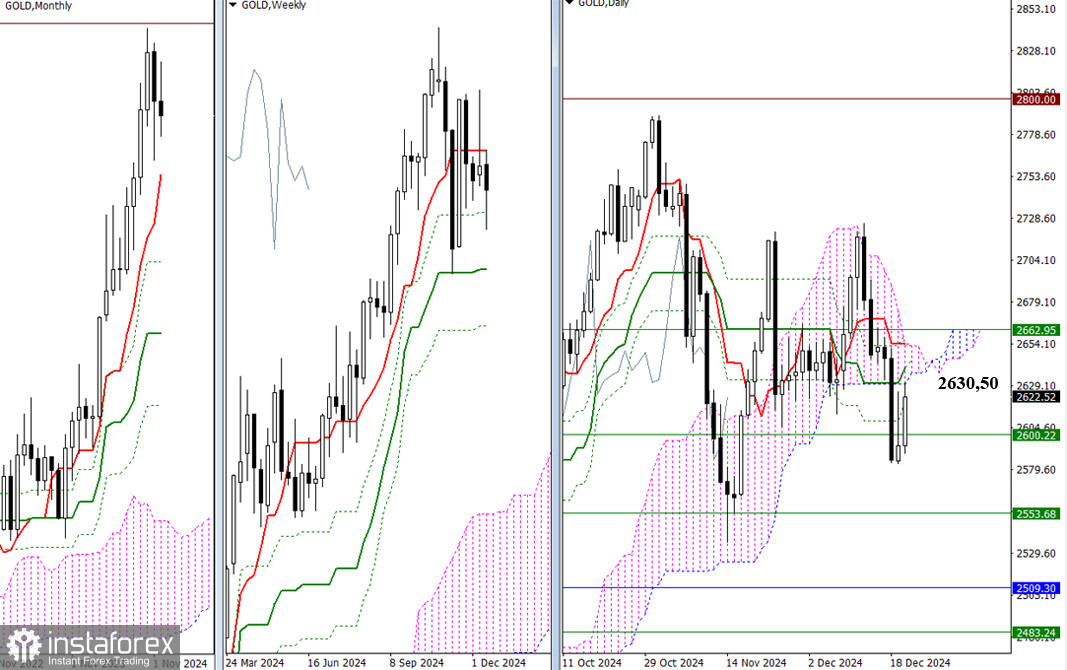
Sepanjang minggu lalu, emas berada dalam zon ketidakpastian, gagal menembusi paras sokongan mingguan pada 2600.22 atau membatalkan persilangan emas harian. Begitu juga, emas tidak mampu melepaskan diri daripada tarikan awan harian pada 2630.50. Menjelang penutupan minggu, emas kembali berada di bawah zon rintangan yang luas (2630.50 – 2662.95), merangkumi awan Ichimoku harian, paras utama persilangan Ichimoku harian, dan aliran jangka pendek mingguan.
Pengukuhan di atas zon rintangan ini akan membolehkan pemain spekulasi kenaikan harga meneroka sasaran baharu, seperti 2725.57 (ekstremum maksimum terdekat) dan 2789.61 – 2800.00 (paras tertinggi rekod dan paras psikologi seterusnya). Walau bagaimanapun, jika percubaan pergerakan menaik gagal dan sentimen penurunan harga menguat, pasaran berkemungkinan akan mengalihkan tumpuan kepada sasaran penurunan. Sasaran ini termasuk paras persilangan emas Ichimoku mingguan (2600.22 – 2553.68 – 2483.24) dan trend jangka pendek bulanan pada 2509.30.
Perlu diingatkan bahawa paras mingguan mungkin disesuaikan apabila pasaran dibuka.
Dalam carta masa lebih rendah, pemain spekulasi penurunan harga tidak berjaya mencapai 100% pencapaian sasaran untuk menembusi awan Ichimoku H4 sebelum kenaikan pembetulan semasa. Oleh demikian, sasaran H4 umumnya boleh dianggap telah dipenuhi. Pada masa ini, pasaran sedang menguji tahap paling kritikal pada carta masa lebih rendah: aliran jangka panjang mingguan pada 2630.98. Kawalan ke atas tahap ini akan menentukan sentimen pasaran, jadi bekerja di atas 2630.98 akan menyokong aliran kepada pemain spekulasi menurun, dan lantunan serta penurunan selanjutnya akan menguatkan sentimen penurunan harga. Sasaran utama intraday akan ditentukan oleh Titik Pivot klasik, dengan tahap dan kedudukan yang dikemas kini tersedia, yang perlu anda fokus setelah dagangan bermula.
***
* Analisis pasaran yang disiarkan di sini adalah bertujuan untuk meningkatkan kesedaran anda, tetapi tidak untuk memberi arahan untuk membuat perdagangan.
Kajian analisis InstaSpot akan membuat anda mengetahui sepenuhnya aliran pasaran! Sebagai pelanggan InstaSpot, anda disediakan sejumlah besar perkhidmatan percuma untuk dagangan yang cekap.
Your IP address shows that you are currently located in the USA. If you are a resident of the United States, you are prohibited from using the services of InstaFintech Group including online trading, online transfers, deposit/withdrawal of funds, etc.
If you think you are seeing this message by mistake and your location is not the US, kindly proceed to the website. Otherwise, you must leave the website in order to comply with government restrictions.
Why does your IP address show your location as the USA?
Please confirm whether you are a US resident or not by clicking the relevant button below. If you choose the wrong option, being a US resident, you will not be able to open an account with InstaSpot anyway.
We are sorry for any inconvenience caused by this message.

