Bearish Symmetrical Triangle
was formed on 21.03 at 10:30:41 (UTC+0)
signal strength 3 of 5

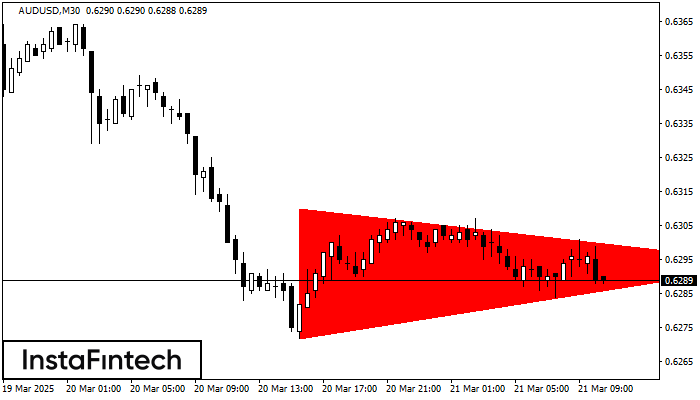
According to the chart of M30, AUDUSD formed the Bearish Symmetrical Triangle pattern. Description: The lower border is 0.6272/0.6294 and upper border is 0.6310/0.6294. The pattern width is measured on the chart at -38 pips. The formation of the Bearish Symmetrical Triangle pattern evidently signals a continuation of the downward trend. In other words, if the scenario comes true and AUDUSD breaches the lower border, the price could continue its move toward 0.6264.
- All
- All
- Bullish Rectangle
- Bullish Symmetrical Triangle
- Double Bottom
- Double Top
- Double Top
- Triple Top
- Triple Top
- Triple Top
- Triple Top
- All
- All
- Buy
- Sale
- All
- 1
- 2
- 3
- 4
- 5
Bullish Rectangle
was formed on 21.04 at 06:10:19 (UTC+0)
signal strength 1 of 5
According to the chart of M5, #Bitcoin formed the Bullish Rectangle which is a pattern of a trend continuation. The pattern is contained within the following borders: the lower border
The M5 and M15 time frames may have more false entry points.
Open chart in a new window
Double Bottom
was formed on 21.04 at 06:05:07 (UTC+0)
signal strength 1 of 5
The Double Bottom pattern has been formed on USDJPY M5. This formation signals a reversal of the trend from downwards to upwards. The signal is that a buy trade should
The M5 and M15 time frames may have more false entry points.
Open chart in a new window
Double Top
was formed on 21.04 at 05:59:59 (UTC+0)
signal strength 1 of 5
The Double Top reversal pattern has been formed on GOLD M5. Characteristics: the upper boundary 3384.89; the lower boundary 3377.85; the width of the pattern is 687 points. Sell trades
The M5 and M15 time frames may have more false entry points.
Open chart in a new window