


Ons team heeft meer dan 7,000,000 handelaren!
Elke dag werken we samen om de handel te verbeteren. We behalen hoge resultaten en gaan verder.
Erkenning door miljoenen handelaren over de hele wereld is de beste waardering voor ons werk! U heeft uw keuze gemaakt en wij zullen er alles aan doen om aan uw verwachtingen te voldoen!
Wij zijn samen een geweldig team!
InstaSpot. Trots om voor je te werken!


Acteur, UFC 6-toernooikampioen en een echte held!
De man die zichzelf heeft gemaakt. De man die onze kant op gaat.
Het geheim achter het succes van Taktarov is een constante beweging naar het doel.
Onthul alle kanten van je talent!
Ontdekken, proberen, falen - maar nooit stoppen!
InstaSpot. Je succesverhaal begint hier!

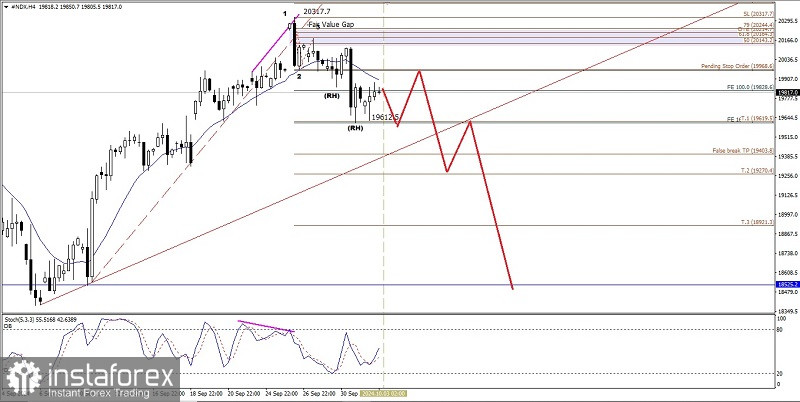
From what we see on the 4-hour chart of the Nasdaq 100 index, there appears to be a deviation between the price movement of the index and the Stochastic Oscillator indicator which is also confirmed by the appearance of a Bearish 123 pattern followed by 2 Bearish Ross Hook (RH) and its price movement moving below the EMA 21 which also has a decreasing slope so that based on these facts in the near future #NDX has the potential to weaken down where the level of 19612.5 will be tested in the near future as long as it does not strengthen again to break and close above the level of 20317.7 then #NDX has the potential to weaken down to the level of 19270.4 and has the potential to continue its weakening to the level of 18525.2 if the momentum and volatility support it.
(Disclaimer)
*The market analysis posted here is meant to increase your awareness, but not to give instructions to make a trade.
InstaSpot analytical reviews will make you fully aware of market trends! Being an InstaSpot client, you are provided with a large number of free services for efficient trading.


