


Ons team heeft meer dan 7,000,000 handelaren!
Elke dag werken we samen om de handel te verbeteren. We behalen hoge resultaten en gaan verder.
Erkenning door miljoenen handelaren over de hele wereld is de beste waardering voor ons werk! U heeft uw keuze gemaakt en wij zullen er alles aan doen om aan uw verwachtingen te voldoen!
Wij zijn samen een geweldig team!
InstaSpot. Trots om voor je te werken!


Acteur, UFC 6-toernooikampioen en een echte held!
De man die zichzelf heeft gemaakt. De man die onze kant op gaat.
Het geheim achter het succes van Taktarov is een constante beweging naar het doel.
Onthul alle kanten van je talent!
Ontdekken, proberen, falen - maar nooit stoppen!
InstaSpot. Je succesverhaal begint hier!

4h
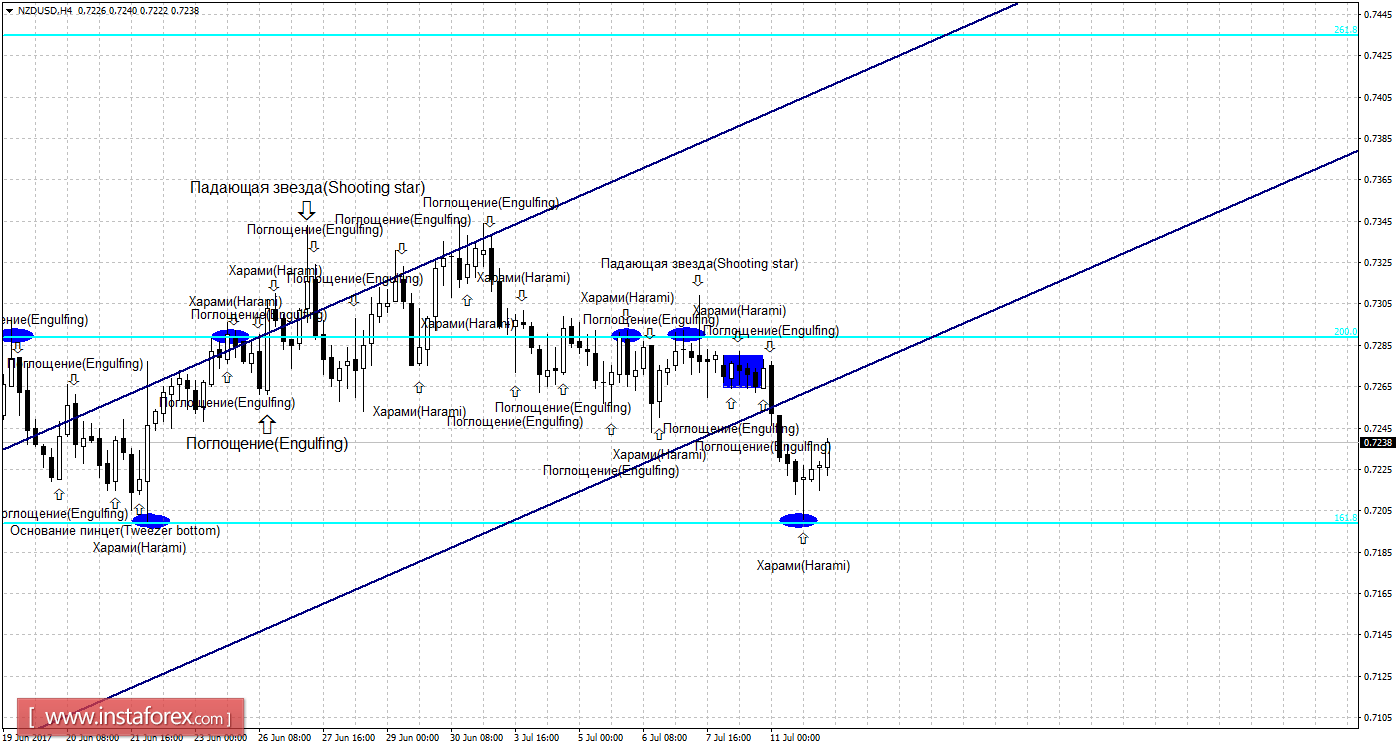
Prices hang up from the correction level of 161.8% to 0.7199 and the formation of bullish Harami candlestick pattern are working in favor of the New Zealand currency.
The expansion started in the direction of the corrective level of 200.0% - 0.7289.
The NZD / USD consolidated below the correction level of 161.8% which will increase chances of further decline in prices towards the next corrective level of 100.0% - 0.7053.
The Fibonacci grid is placed on extremes from April 24, 2017 and May 11, 2017.
Daily
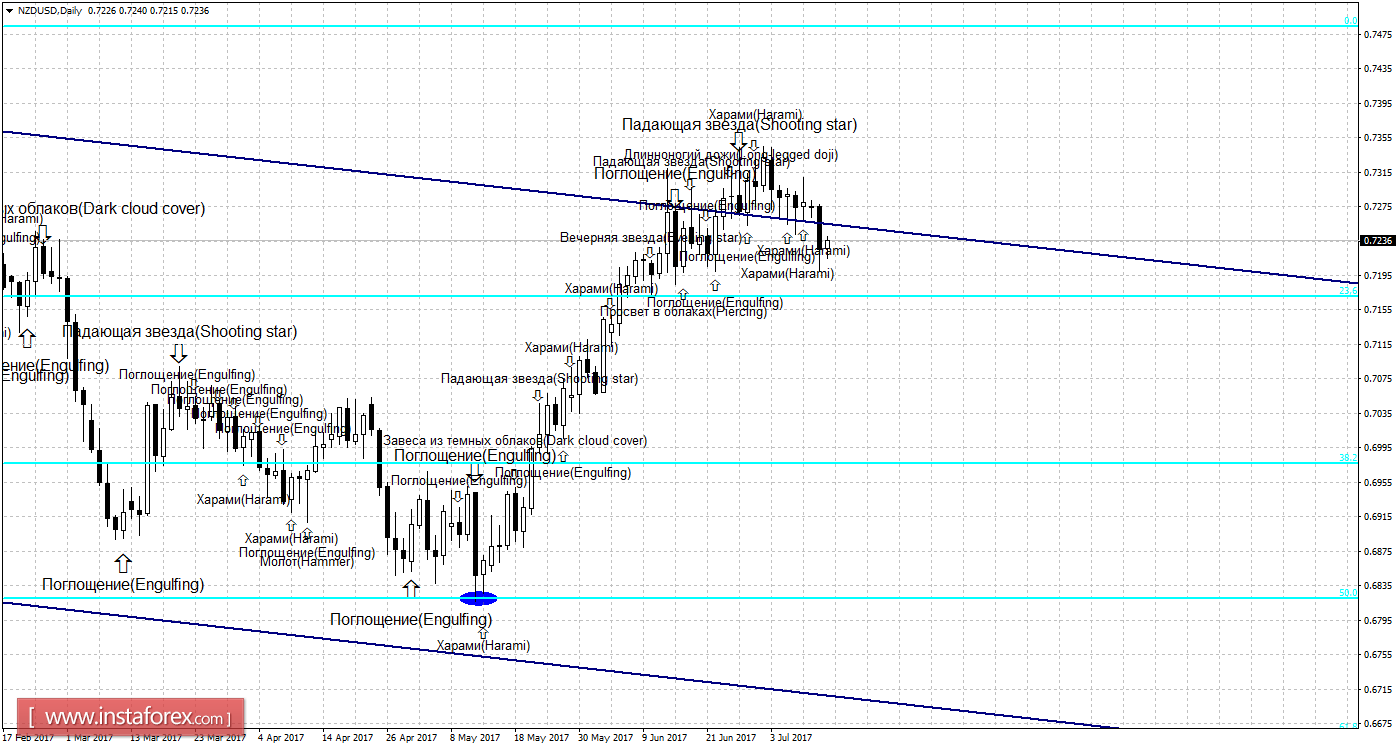
The weakening of the NZD / USD pair continues as shown the 24-hour chart towards the direction of the correction level of 23.6% - 0.7172. The pair's retracement level of 23.6% is expected to allow traders make a move favorable to the New Zealand currency and some development approaching the correction level of 0.0% - 0.7484. The formation of the bullish candle pattern will also work inclined with the initial growth of the pair. The pair consolidated below the Fibo level of 23.6% had increased chances of continuing the decline towards the next correction level of 38.2% - 0.6977.
The Fibonacci grid is located on extremes from August 24, 2015 and September 8, 2016.
Specification:
Weak candle formations will be marked with plain text and a smaller size of arrows.
Strong candle formations will be marked with bold text and a larger size of arrows.
*The market analysis posted here is meant to increase your awareness, but not to give instructions to make a trade.
InstaSpot analytical reviews will make you fully aware of market trends! Being an InstaSpot client, you are provided with a large number of free services for efficient trading.
Training video

Your IP address shows that you are currently located in the USA. If you are a resident of the United States, you are prohibited from using the services of InstaFintech Group including online trading, online transfers, deposit/withdrawal of funds, etc.
If you think you are seeing this message by mistake and your location is not the US, kindly proceed to the website. Otherwise, you must leave the website in order to comply with government restrictions.
Why does your IP address show your location as the USA?
Please confirm whether you are a US resident or not by clicking the relevant button below. If you choose the wrong option, being a US resident, you will not be able to open an account with InstaSpot anyway.
We are sorry for any inconvenience caused by this message.


