


Ons team heeft meer dan 7,000,000 handelaren!
Elke dag werken we samen om de handel te verbeteren. We behalen hoge resultaten en gaan verder.
Erkenning door miljoenen handelaren over de hele wereld is de beste waardering voor ons werk! U heeft uw keuze gemaakt en wij zullen er alles aan doen om aan uw verwachtingen te voldoen!
Wij zijn samen een geweldig team!
InstaSpot. Trots om voor je te werken!


Acteur, UFC 6-toernooikampioen en een echte held!
De man die zichzelf heeft gemaakt. De man die onze kant op gaat.
Het geheim achter het succes van Taktarov is een constante beweging naar het doel.
Onthul alle kanten van je talent!
Ontdekken, proberen, falen - maar nooit stoppen!
InstaSpot. Je succesverhaal begint hier!

In my morning forecast, I highlighted the level of 1.1151 and planned to make market entry decisions based on it. Let us review the 5-minute chart to analyze what happened. A rise and the formation of a false breakout near 1.1151 led to a selling entry for the euro, but there was no significant decline. After a 10-point correction, the euro resumed its growth. I have now revised the technical picture for the second half of the day.
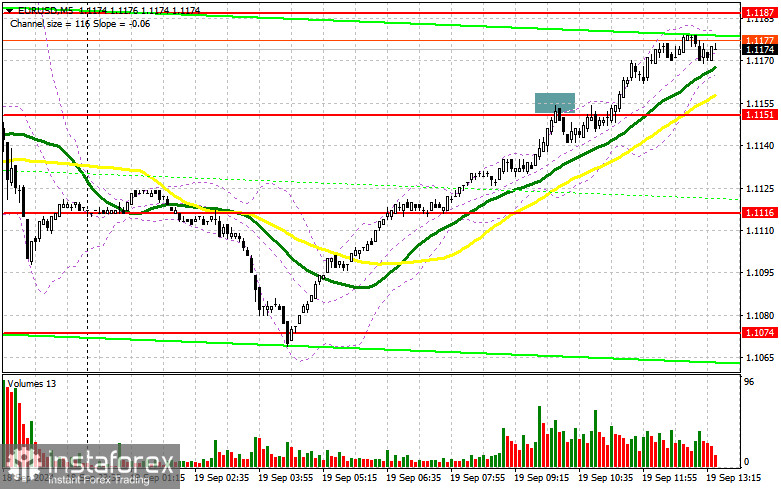
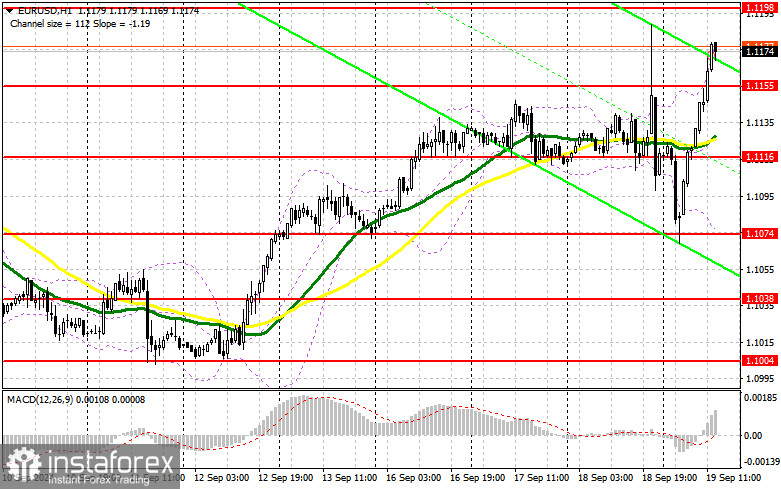
We await the release of U.S. weekly initial jobless claims, the Philadelphia Fed manufacturing index, and the current account balance. There is also a report on existing home sales, which plays a secondary role. Considering how actively the euro was bought throughout the first half of the day, without a major seller emerging (which now seems unlikely), betting on the continued rise of EUR/USD appears prudent. If U.S. data turns out to be very strong, we might see a correction, which I plan to capitalize on. A false breakout near the closest support at 1.1155 will create the necessary conditions for long positions, continuing the bullish trend with the target of restoring the pair to the 1.1198 level – a new key resistance level. A breakout followed by a retest from above will lead to further growth towards testing 1.1237. The final target will be 1.1274, where I will take profit.
If EUR/USD declines and there is no buying interest around 1.1155 in the second half of the day, pressure on the pair will increase, leading to a larger selloff. In that case, I will enter long positions only after a false breakout near the next support at 1.1116, which lies just above the moving averages. Alternatively, I will consider opening long positions on the first sign of a rebound from 1.1074, targeting an intraday upward correction of 30-35 points.
Sellers will have a chance to push the euro down if U.S. data is strong, or if large players take action around the resistance at 1.1198. A false breakout there will provide an ideal condition for opening short positions, aiming for a small correction and a retest of the 1.1155 support level, formed during the first half of the day. A breakout and consolidation below this range, followed by a retest from below, will provide another selling opportunity, with a target of 1.1116, where I expect large euro buyers to emerge. The final target will be the 1.1074 level, which would cancel bulls' plans for further growth. I will take profit there.
If EUR/USD rises and sellers don't appear at 1.1198, buyers will continue building the bullish trend, with a potential move towards updating the resistance at 1.1237. I will also consider selling there but only after a failed breakout. I plan to open short positions immediately on a rebound from 1.1274, targeting a downward correction of 30-35 points.
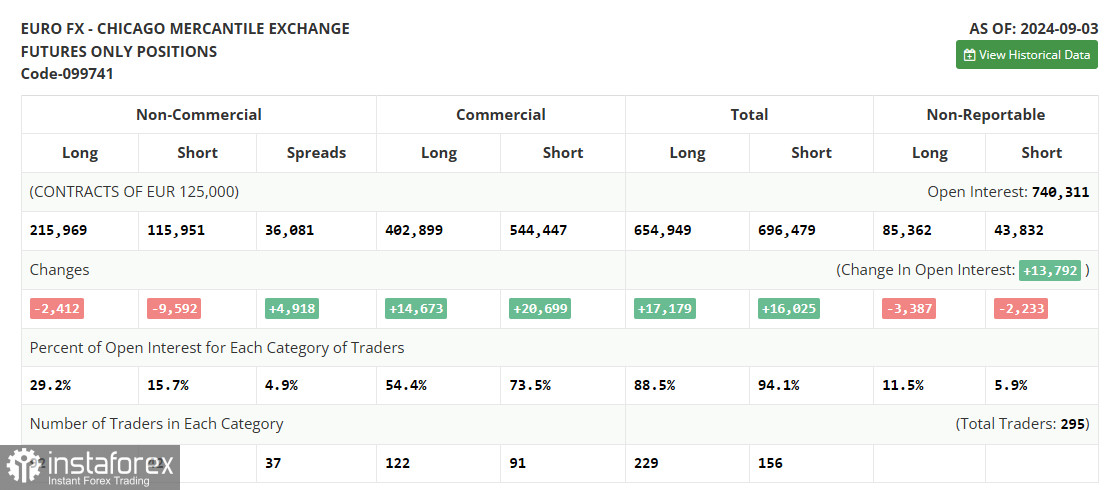
In the COT (Commitment of Traders) report for September 3, there was a reduction in both long and short positions. Despite the decrease in euro sellers, the bearish technical picture for the pair remains unchanged. The euro is likely to continue losing ground against the U.S. dollar this week, as we approach the European Central Bank meeting, where another rate cut and further monetary policy adjustments are expected. However, this does not cancel the medium-term uptrend for the euro, and the lower the pair goes, the more attractive it becomes for buying.
The COT report shows that non-commercial long positions decreased by 2,412 to 215,969, while short positions fell by 9,592 to 115,951. As a result, the gap between long and short positions increased by 4,918.
Moving Averages:
Trading is above the 30- and 50-day moving averages, indicating further euro growth.
Note: The author uses a 1-hour H1 chart, which may differ from the classic daily D1 chart moving averages.
Bollinger Bands:
In case of a decline, the lower boundary of the Bollinger Bands indicator around 1.1074 will act as support.
*The market analysis posted here is meant to increase your awareness, but not to give instructions to make a trade.
InstaSpot analytical reviews will make you fully aware of market trends! Being an InstaSpot client, you are provided with a large number of free services for efficient trading.


