


Ons team heeft meer dan 7,000,000 handelaren!
Elke dag werken we samen om de handel te verbeteren. We behalen hoge resultaten en gaan verder.
Erkenning door miljoenen handelaren over de hele wereld is de beste waardering voor ons werk! U heeft uw keuze gemaakt en wij zullen er alles aan doen om aan uw verwachtingen te voldoen!
Wij zijn samen een geweldig team!
InstaSpot. Trots om voor je te werken!


Acteur, UFC 6-toernooikampioen en een echte held!
De man die zichzelf heeft gemaakt. De man die onze kant op gaat.
Het geheim achter het succes van Taktarov is een constante beweging naar het doel.
Onthul alle kanten van je talent!
Ontdekken, proberen, falen - maar nooit stoppen!
InstaSpot. Je succesverhaal begint hier!

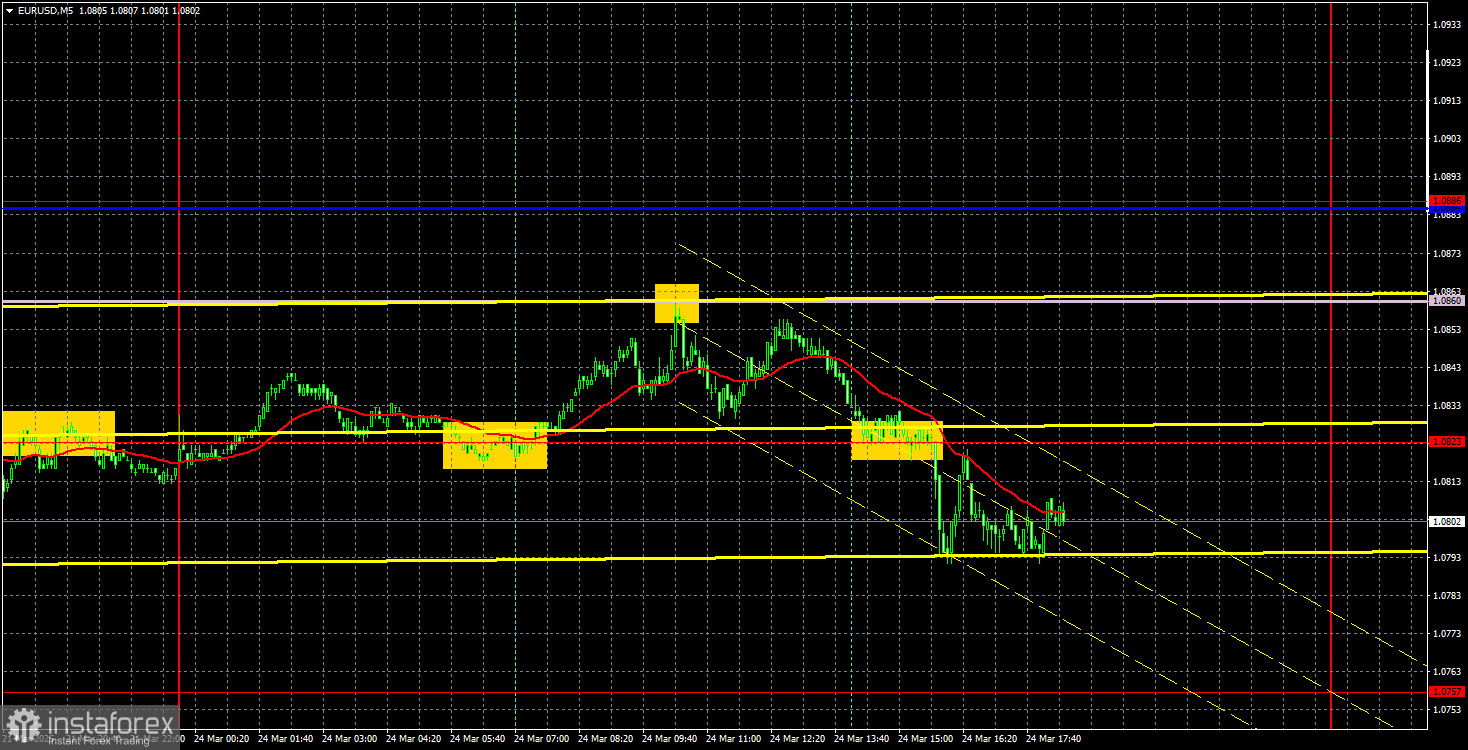
On Monday, the EUR/USD currency pair initially showed an upward move, followed by a decline, making the entire trading day somewhat contradictory. Volatility remained low despite the release of six reports throughout the day. They all were PMI indices for the services and manufacturing sectors in Germany, the Eurozone, and the U.S. These reports contradicted one another. Take Germany, for example. The services PMI fell and came in below forecast, while the manufacturing PMI rose and beat expectations. In the Eurozone, the services index dropped and was below forecast, while manufacturing rose and exceeded expectations. In the U.S., the services PMI posted strong growth above forecast, while the manufacturing index fell below both the forecast and the 50.0 level. So, how should this mix of data be interpreted?
The market didn't bother too much with that question. As we've said, macroeconomic data is currently of little importance. The market continues to trade on "Donald Trump," awaiting his next round of tariffs, and is currently just undergoing a correction. This is why we are observing a sluggish decline in the pair. An upward move could resume anytime, even if it contradicts the daily and monthly timeframes. However, on the hourly chart, the trend has now shifted to bearish.
Among Monday's trading signals, we can highlight the bounce from the 1.0823 level and the Senkou Span B line. In the first case, traders could buy, and in the second, sell. Both trades were profitable and allowed for gains of at least 50 pips.
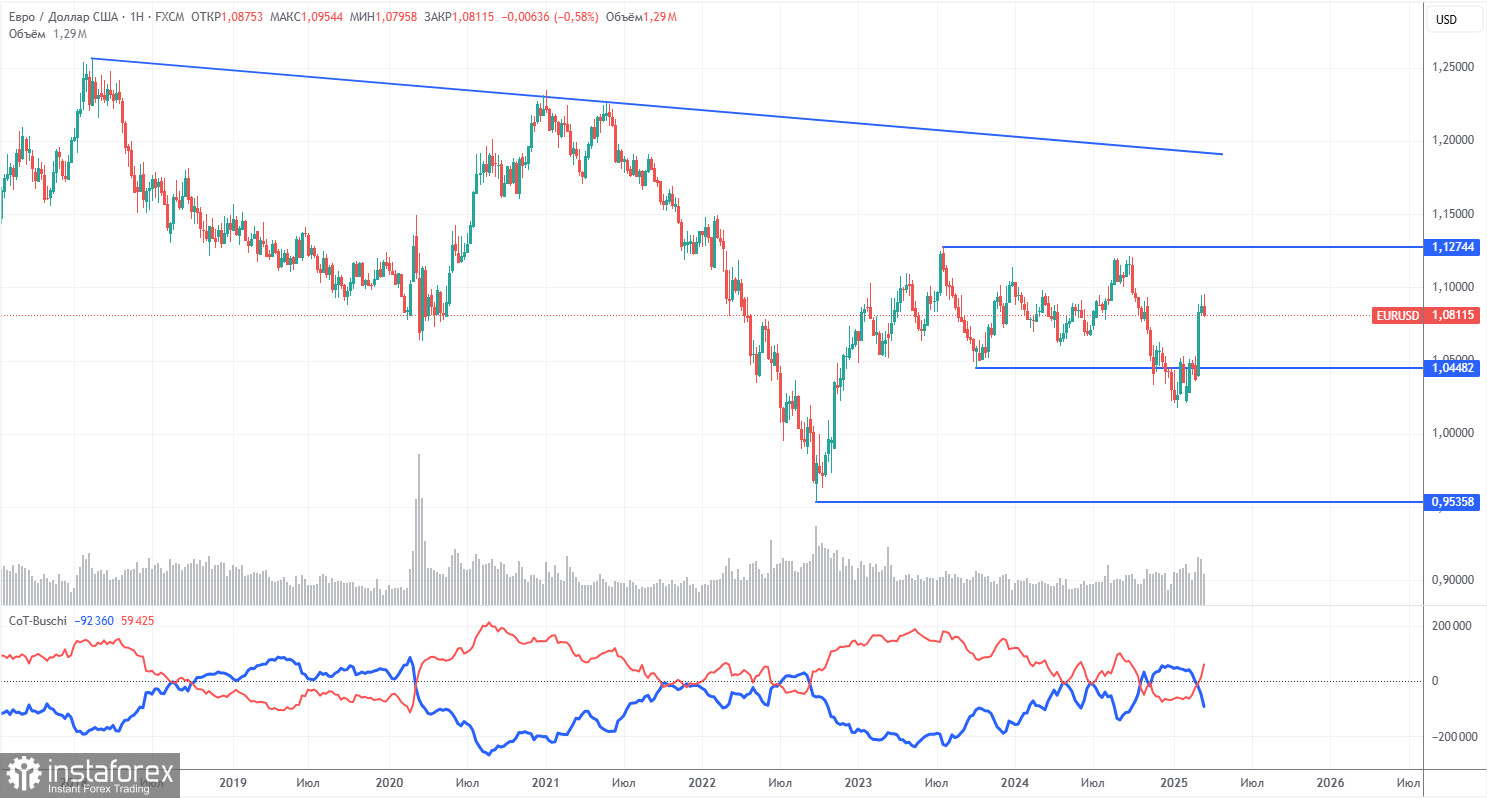
The latest Commitment of Traders (COT) report is dated March 18. As shown in the illustration, the net position of non-commercial traders remained bullish for a long time. The bears only recently gained a slight advantage, but now the bulls are back in control. Bearish positioning has quickly eroded since Trump assumed office and the dollar collapsed. We can't definitively say the dollar's decline will continue, and COT data reflects the sentiment of large players, which can shift rapidly in current conditions.
We still don't see any fundamental factors supporting euro strength, but there is now one powerful reason for dollar weakness. The pair may continue to correct for several weeks or months, but the 16-year downtrend won't reverse quickly.
Currently, the red and blue lines have crossed again, indicating a bullish trend. In the most recent reporting week, the number of long positions in the non-commercial group increased by 300 contracts, while the number of short positions fell by 46,000 contracts. As a result, the net position rose by 45,700 contracts.
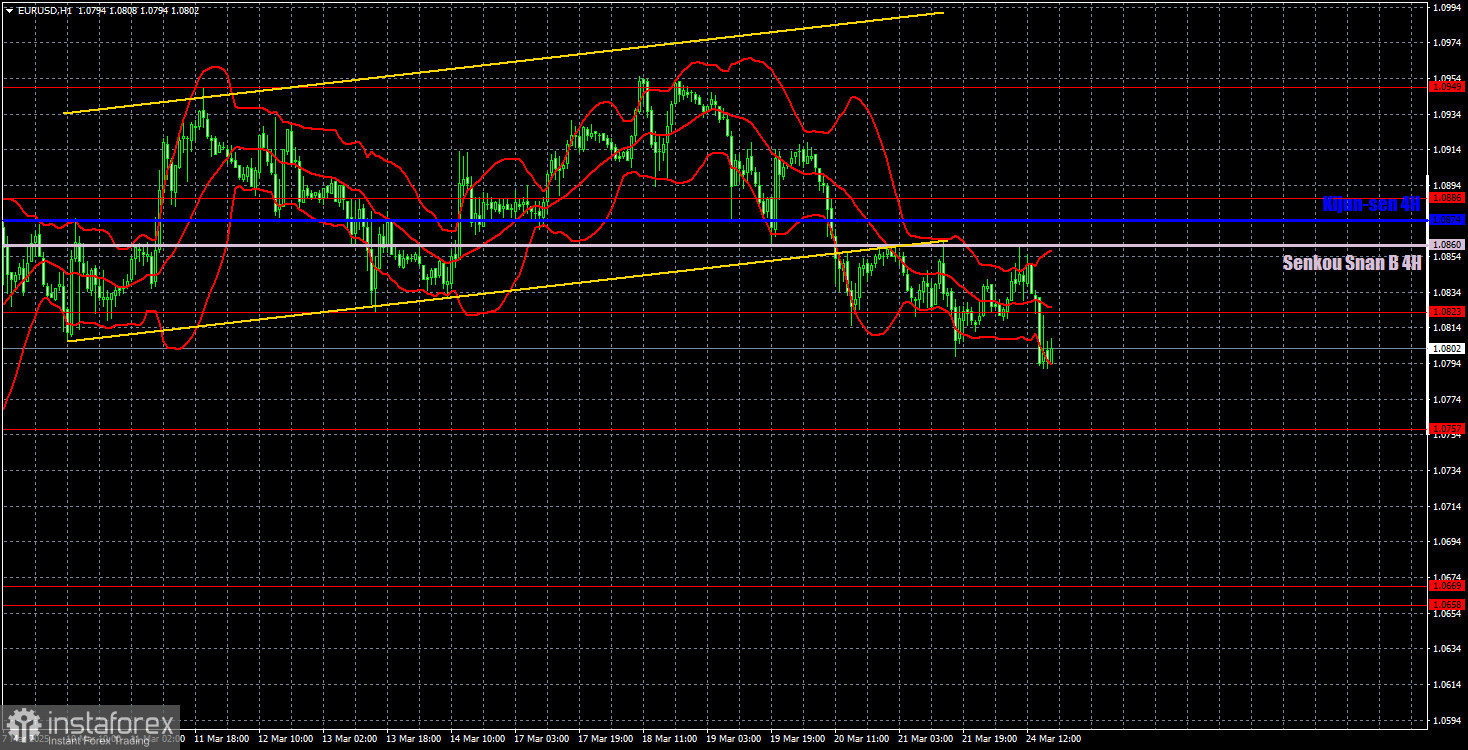
The price is tilting downward on the hourly timeframe, and we fully support this movement. We expect the decline to resume in the medium term due to the divergence in ECB and Fed monetary policy. However, it's unclear how long the market will continue pricing in the "Trump factor." The recent upward movement looked more like a personal protest against Trump, and it's unclear where this will ultimately lead the pair—especially since more tariffs could still be announced. Traders ignore many news events and reports, and the dollar is being sold off at any opportunity.
For March 25, the following levels are relevant for trading: 1.0340–1.0366, 1.0461, 1.0524, 1.0585, 1.0658–1.0669, 1.0757, 1.0797, 1.0823, 1.0886, 1.0949, 1.1006, 1.1092, as well as the Senkou Span B line (1.0860) and the Kijun-sen line (1.0874). Ichimoku indicator lines may shift during the day and should be considered when identifying trading signals. Don't forget to move your Stop Loss to breakeven once the price moves 15 pips in the intended direction—this will help protect against false signals.
Germany will release its Ifo Business Climate report on Tuesday, and the U.S. will publish New Home Sales data. Both reports are tertiary in importance and unlikely to influence market sentiment. We believe the current correction will continue, but the movement doesn't yet resemble the beginning of a new downtrend—not even on the hourly timeframe.
*The market analysis posted here is meant to increase your awareness, but not to give instructions to make a trade.
InstaSpot analytical reviews will make you fully aware of market trends! Being an InstaSpot client, you are provided with a large number of free services for efficient trading.
InstaForex club

Your IP address shows that you are currently located in the USA. If you are a resident of the United States, you are prohibited from using the services of InstaFintech Group including online trading, online transfers, deposit/withdrawal of funds, etc.
If you think you are seeing this message by mistake and your location is not the US, kindly proceed to the website. Otherwise, you must leave the website in order to comply with government restrictions.
Why does your IP address show your location as the USA?
Please confirm whether you are a US resident or not by clicking the relevant button below. If you choose the wrong option, being a US resident, you will not be able to open an account with InstaSpot anyway.
We are sorry for any inconvenience caused by this message.


