Het wimpelpatroon is een bekend patroon dat veel wordt gebruikt in technische analyse. Dit cijfer wordt regelmatig aangetroffen op trading charts van bijna alle valutaparen.
Het wimpelpatroon kan zowel bullish als bearish zijn. Voor een bullish wimpel wordt een vlaggenmast naar boven gericht met een wimpel op het hoogste punt. Een bearish wimpel heeft een naar beneden gerichte vlaggenmast met de vorming van een hoek op het laagste punt van de trend.
Het wimpelpatroon begint met een vlaggenmast in de vorm van een reeks kaarsen die in dezelfde richting gaan. Dit kan een trend zijn of een eenvoudige prijsimpuls. Als we de markt onmiddellijk nauwlettend volgen na het bereiken van het laagste punt van de dalende trend (het hoogste punt van de bullish trend), kunnen we de vorming van het laatste deel van het patroon bepalen - een symmetrische driehoek. Merk op dat het wimpelpatroon zich relatief snel vormt. Op het moment dat de twee lijnen die door de toppen en dieptepunten lopen behoorlijk scherp naar elkaar toe convergeren en een kleine driehoek vormen, kunnen we gerust zeggen over de vorming van de Wimpel.
De juiste tijd voor het betreden van de markt is het moment waarop de koers door de Pennant-lijn breekt die een driehoek vormt in de richting van zijn belangrijkste trend ten opzichte van de vlaggenmast.
Werkelijke patronen
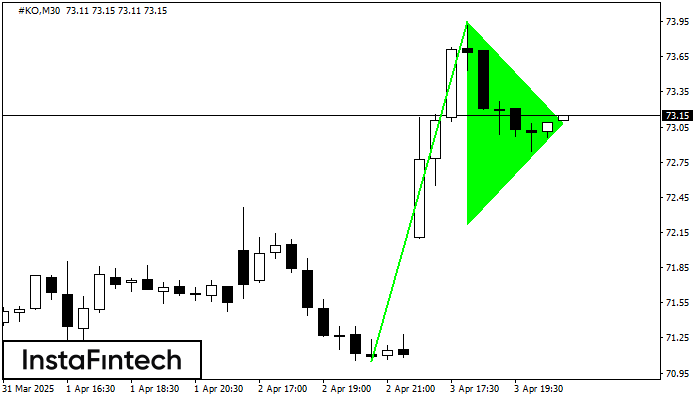
Bullish pennant
was formed on 03.04 at 20:00:31 (UTC+0)
signal strength 3 of 5
The Bullish pennant signal – Trading instrument #KO M30, continuation pattern. Forecast: it is possible to set up a buy position above the pattern’s high of 73.95, with the prospect
Open chart in a new window
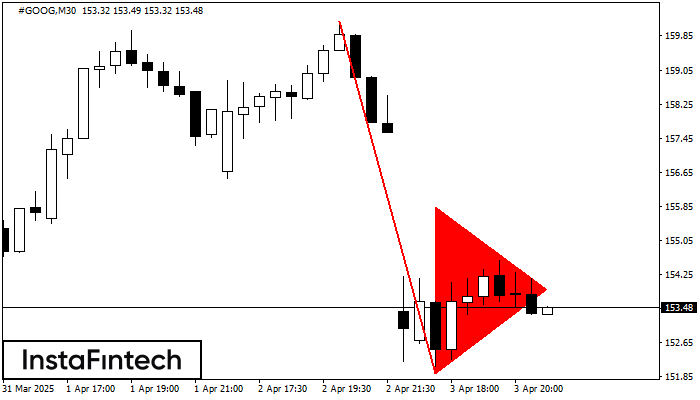
Bearish pennant
was formed on 03.04 at 20:00:14 (UTC+0)
signal strength 3 of 5
The Bearish pennant pattern has formed on the #GOOG M30 chart. It signals potential continuation of the existing trend. Specifications: the pattern’s bottom has the coordinate of 151.94; the projection
Open chart in a new window
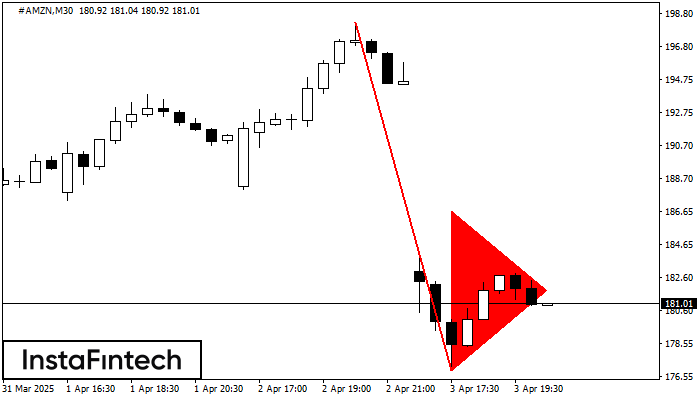
Bearish pennant
was formed on 03.04 at 19:30:13 (UTC+0)
signal strength 3 of 5
The Bearish pennant pattern has formed on the #AMZN M30 chart. The pattern signals continuation of the downtrend in case the pennant’s low of 176.95 is broken through. Recommendations: Place
Open chart in a new window


