Actual patterns

Patterns are graphical models which are formed in the chart by the price. According to one of the technical analysis postulates, history (price movement) repeats itself. It means that the price movements are often similar in the same situations which makes it possible to predict the further development of the situation with a high probability.
Relevant patterns by InstaSpot is an easy-to-use service which allows you to be aware of latest changes in the market and react to clues from the market in time. In our service you will always find the latest and most relevant patterns on any pair and any timeframe.
Double Bottom
was formed on 31.03 at 13:30:19 (UTC+0)
signal strength 3 of 5
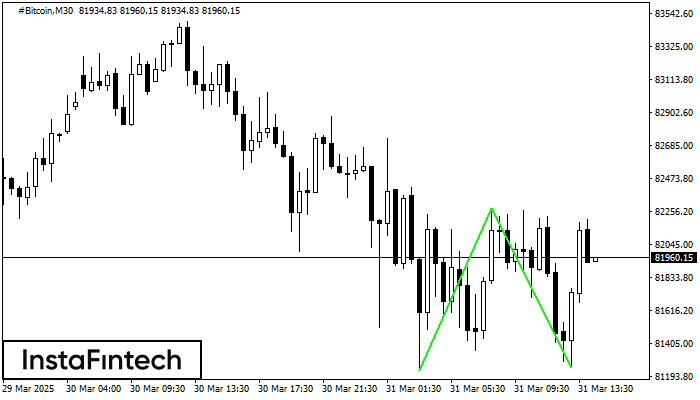
The Double Bottom pattern has been formed on #Bitcoin M30. This formation signals a reversal of the trend from downwards to upwards. The signal is that a buy trade should be opened after the upper boundary of the pattern 82275.64 is broken. The further movements will rely on the width of the current pattern 104454 points.
See Also
- All
- All
- Bullish Rectangle
- Bullish Symmetrical Triangle
- Bullish Symmetrical Triangle
- Double Bottom
- Double Top
- Double Top
- Triple Top
- Triple Top
- Triple Top
- Triple Top
- All
- All
- Buy
- Sale
- All
- 1
- 2
- 3
- 4
- 5
Bearish pennant
was formed on 16.04 at 18:00:05 (UTC+0)
signal strength 2 of 5
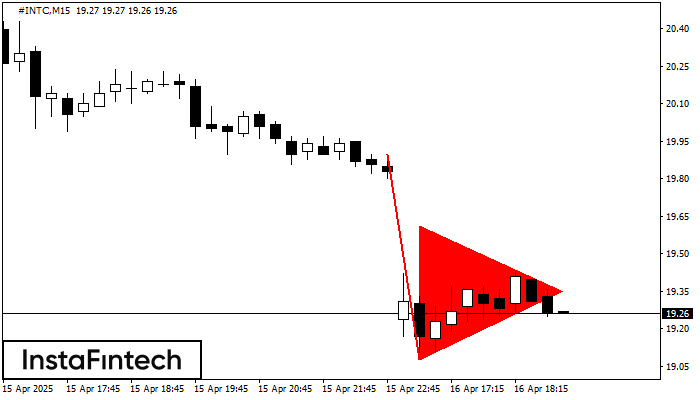
The Bearish pennant pattern has formed on the #INTC M15 chart. It signals potential continuation of the existing trend. Specifications: the pattern’s bottom has the coordinate of 19.08; the projection
The M5 and M15 time frames may have more false entry points.
Open chart in a new window
Triple Top
was formed on 16.04 at 17:50:25 (UTC+0)
signal strength 1 of 5
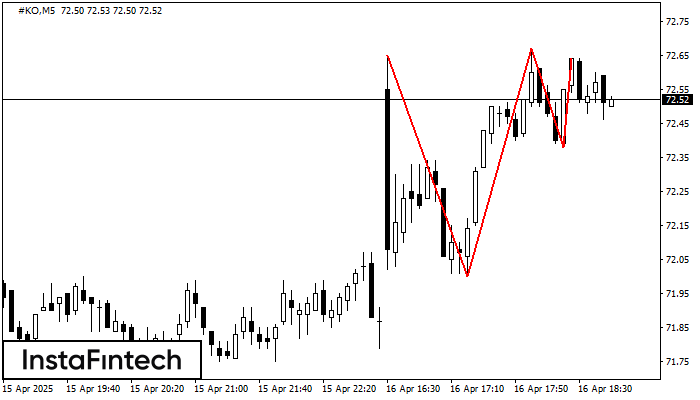
The Triple Top pattern has formed on the chart of the #KO M5 trading instrument. It is a reversal pattern featuring the following characteristics: resistance level 1, support level -38
The M5 and M15 time frames may have more false entry points.
Open chart in a new window
Double Top
was formed on 16.04 at 17:20:23 (UTC+0)
signal strength 1 of 5
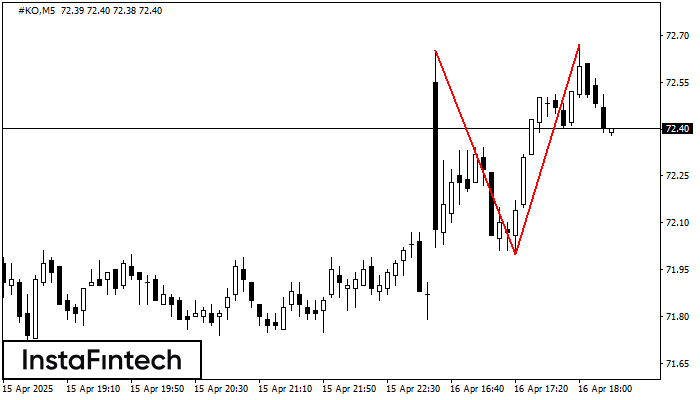
The Double Top pattern has been formed on #KO M5. It signals that the trend has been changed from upwards to downwards. Probably, if the base of the pattern 72.00
The M5 and M15 time frames may have more false entry points.
Open chart in a new window