Actual patterns

Patterns are graphical models which are formed in the chart by the price. According to one of the technical analysis postulates, history (price movement) repeats itself. It means that the price movements are often similar in the same situations which makes it possible to predict the further development of the situation with a high probability.
Relevant patterns by InstaSpot is an easy-to-use service which allows you to be aware of latest changes in the market and react to clues from the market in time. In our service you will always find the latest and most relevant patterns on any pair and any timeframe.
Double Bottom
was formed on 04.04 at 12:15:28 (UTC+0)
signal strength 1 of 5
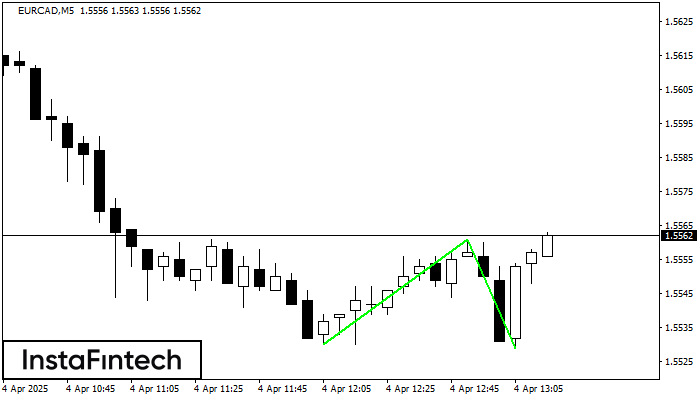
The Double Bottom pattern has been formed on EURCAD M5. Characteristics: the support level 1.5530; the resistance level 1.5561; the width of the pattern 31 points. If the resistance level is broken, a change in the trend can be predicted with the first target point lying at the distance of 32 points.
The M5 and M15 time frames may have more false entry points.
- All
- All
- Bullish Rectangle
- Bullish Symmetrical Triangle
- Bullish Symmetrical Triangle
- Double Bottom
- Double Top
- Double Top
- Triple Top
- Triple Top
- Triple Top
- Triple Top
- All
- All
- Buy
- Sale
- All
- 1
- 2
- 3
- 4
- 5
Double Top
was formed on 20.04 at 00:11:29 (UTC+0)
signal strength 1 of 5

The Double Top pattern has been formed on #Bitcoin M5. It signals that the trend has been changed from upwards to downwards. Probably, if the base of the pattern 85200.45
The M5 and M15 time frames may have more false entry points.
Open chart in a new window
Bullish Rectangle
was formed on 19.04 at 17:03:40 (UTC+0)
signal strength 1 of 5

According to the chart of M5, #Bitcoin formed the Bullish Rectangle. This type of a pattern indicates a trend continuation. It consists of two levels: resistance 85457.12 and support 85308.07
The M5 and M15 time frames may have more false entry points.
Open chart in a new window
Double Top
was formed on 19.04 at 16:44:37 (UTC+0)
signal strength 1 of 5

The Double Top reversal pattern has been formed on #Bitcoin M5. Characteristics: the upper boundary 85455.73; the lower boundary 85324.27; the width of the pattern is 13285 points. Sell trades
The M5 and M15 time frames may have more false entry points.
Open chart in a new window