


Actual patterns

Patterns are graphical models which are formed in the chart by the price. According to one of the technical analysis postulates, history (price movement) repeats itself. It means that the price movements are often similar in the same situations which makes it possible to predict the further development of the situation with a high probability.
Relevant patterns by InstaSpot is an easy-to-use service which allows you to be aware of latest changes in the market and react to clues from the market in time. In our service you will always find the latest and most relevant patterns on any pair and any timeframe.
Bearish pennant
was formed on 07.04 at 01:00:16 (UTC+0)
signal strength 3 of 5

The Bearish pennant pattern has formed on the NZDUSD M30 chart. It signals potential continuation of the existing trend. Specifications: the pattern’s bottom has the coordinate of 0.5563; the projection of the flagpole height is equal to 29 pips. In case the price breaks out the pattern’s bottom of 0.5563, the downtrend is expected to continue for further level 0.5533.
- All
- All
- Bullish Rectangle
- Bullish Symmetrical Triangle
- Bullish Symmetrical Triangle
- Double Bottom
- Double Top
- Double Top
- Triple Top
- Triple Top
- Triple Top
- Triple Top
- All
- All
- Buy
- Sale
- All
- 1
- 2
- 3
- 4
- 5
Triplo Minimo
was formed on 18.04 at 20:00:30 (UTC+0)
signal strength 3 of 5
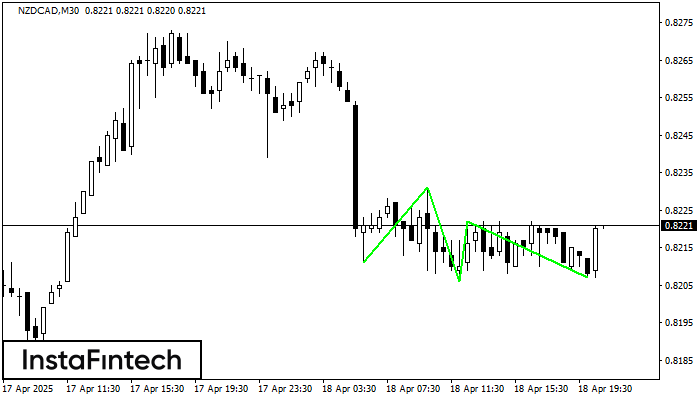
Il modello Triplo Minimo si è formato sul grafico dello strumento di trading NZDCAD M30. Il modello segnala un cambiamento nel trend dal discendente all'ascendente in caso di rottura
Open chart in a new window
Triplo Massimo
was formed on 18.04 at 18:00:33 (UTC+0)
signal strength 3 of 5
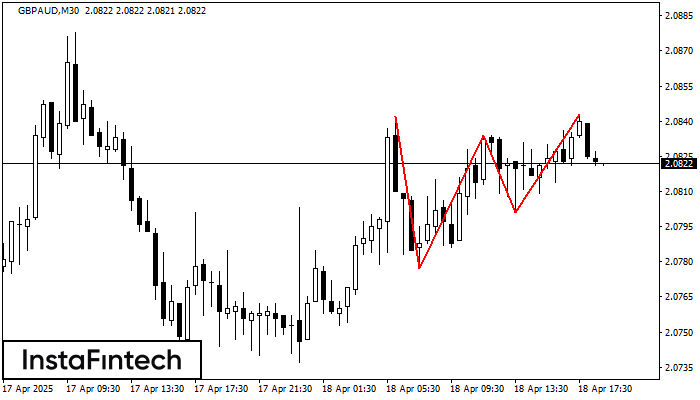
Il modello Triplo Massimo si è formato sul grafico del GBPAUD M30. Caratteristiche del modello: i confini hanno un angolo ascendente; la linea inferiore del modello ha le coordinate 2.0777/2.0801
Open chart in a new window
Triplo Massimo
was formed on 18.04 at 17:30:31 (UTC+0)
signal strength 3 of 5
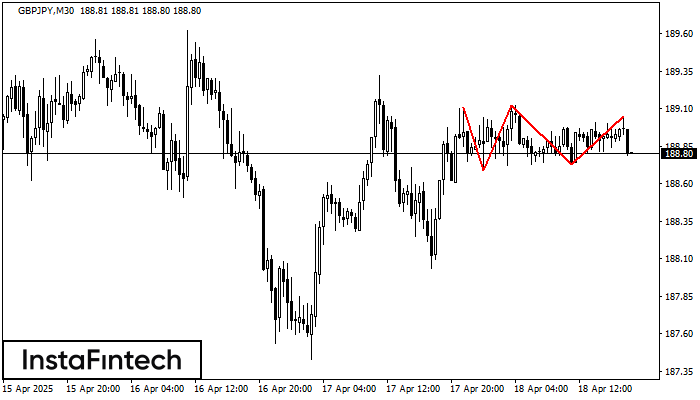
Sul grafico dello strumento di trading GBPJPY M30, si è formato il modello Triplo Massimo che segnala un cambiamento di trend. È possibile che dopo la formazione del terzo picco
Open chart in a new window


