


ہمارے ٹیم میں 7000000 سے ذائد تاجران شامل ہیں
ہم تجارت کی بہتری کے لئے ہر روز اکھٹے کام کرتے ہیں اور بہترین نتائج حاصل کرتے ہوئے آگے کی جانب بڑھتے ہیں
دُنیا بھر سے سے لاکھوں ہمارے بہترین کام کو سند عطاء کرتے ہیں آپ اپنا انتحاب کریں باقی ہم آپ کی توقعات پر پورا اترنے کے لئے اپنی بہترین کوشش کریں گے
ہم مل کر ایک بہترین ٹیم بناتے ہیں
انسٹا فاریکس آپ سے کام کرتے ہوئے فخر محسوس کرتا ہے


ایکٹر - یو سی ایف 6 ٹورنامنٹ چیمپین اور واقعی ہیرو
ایک فرد کے جس نے اپنا آپ منوایا ہے وہ فرد کہ جو ہماری راہ پر چلا ہے.
ٹکٹا روو کی کامیابی کا راز یہ ہے کہ وہ اپنے اہداف کی جانب مسلسل بڑھتا رہتا ہے
اپنے ہنر یا ٹیلنٹ کے تمام پہلو آشکار کررہے ہیں
پہچانیں ، کوشش کریں ، ناکام ہوں لیکن کبھی نہ رُکیں
انسٹا فاریکس آپ کی کامیابی کی کہاں یہاں سے شروع ہوتی ہے

On Wednesday, inflation data for the United Kingdom was published, dropping to the September 2021 low. The Consumer Price Index fell from 4.6% to 3.9%, versus the expected 4.3%. Thus, the Bank of England is likely no longer able to avoid the question of reducing the interest rate. The reaction of the pound sterling was corresponding, which swiftly began to decline in value.
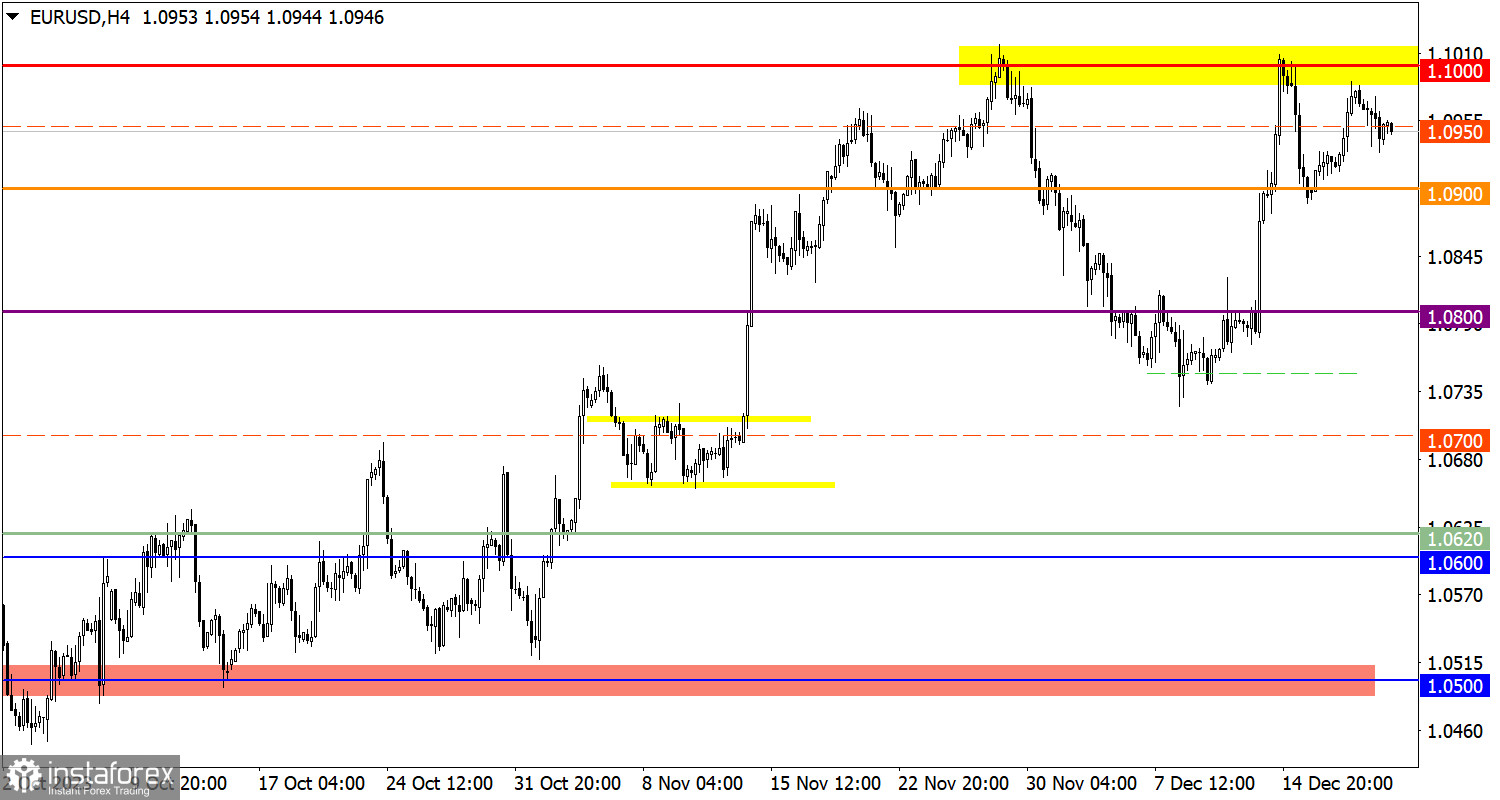
The EUR/USD currency pair reduced the volume of long positions near the 1.1000 mark. This move led to another rebound in price from the resistance level.
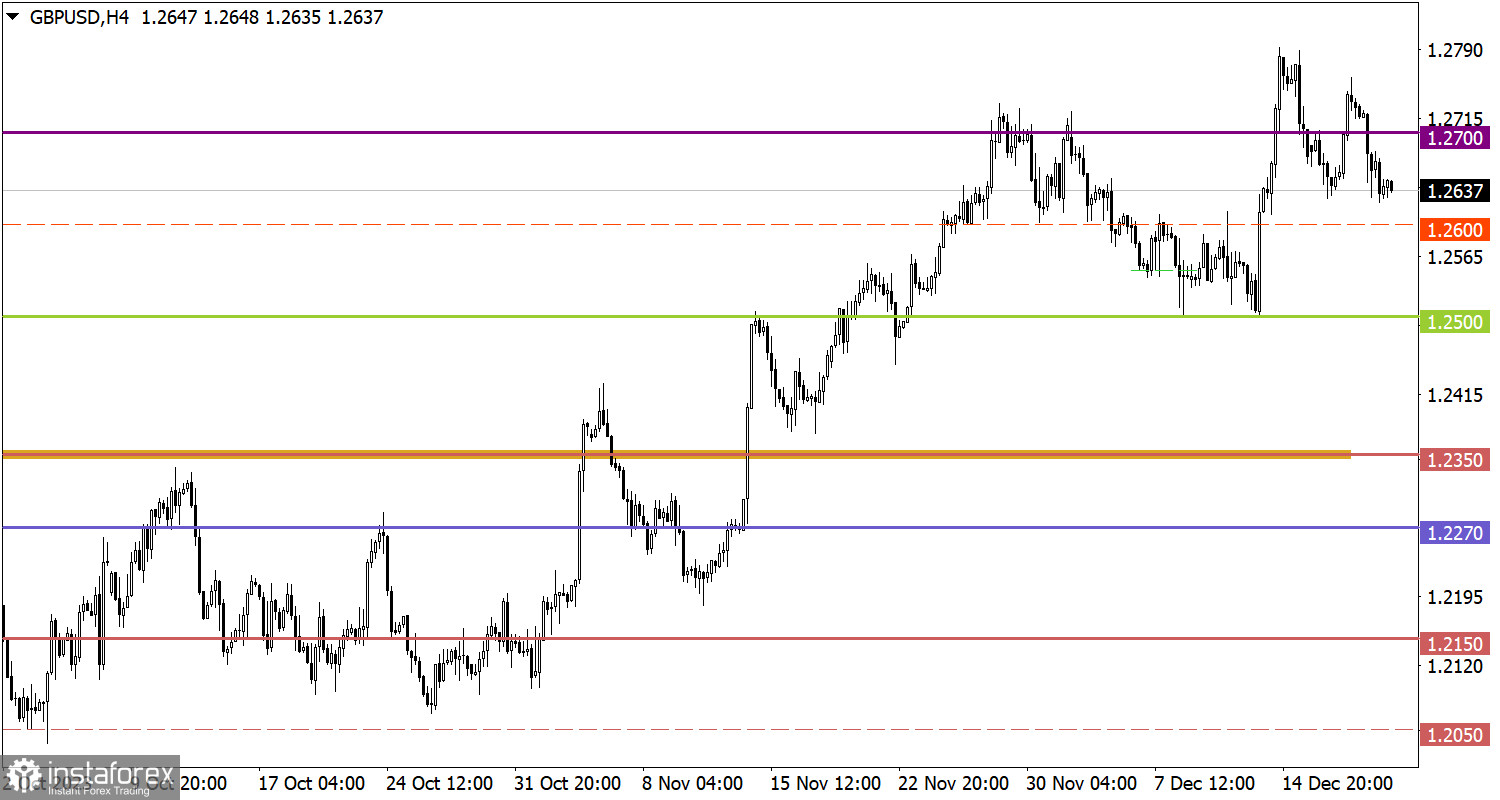
The GBP/USD pair traded in a downward trend, during which the quote managed to update the local low of the correction cycle.

Today, the publication of data on jobless claims in the United States is expected, where an overall increase in this indicator is predicted. Statistical data details indicate that the volume of continuing claims for benefits may rise from 1.876 million to 1.888 million, and the volume of initial claims may rise from 202,000 to 215,000.
Time Targeting:
U.S. jobless claims – 13:30 UTC
With further decline, the quote may reach the level of 1.0900. To continue the upward trend, price stabilization above the level of 1.1000 is necessary.
If the price stabilizes below 1.2600, this may lead to further depreciation of the pound sterling to the level of 1.2500.
As for the upward scenario, for its consideration, the quote needs to first rise above the level of 1.2700 with confirmation on the daily period.
The candlestick chart type is white and black graphic rectangles with lines above and below. With a detailed analysis of each individual candle, you can see its characteristics relative to a particular time frame: opening price, closing price, intraday high and low.
Horizontal levels are price coordinates, relative to which a price may stop or reverse its trajectory. In the market, these levels are called support and resistance.
Circles and rectangles are highlighted examples where the price reversed in history. This color highlighting indicates horizontal lines that may put pressure on the asset's price in the future.
The up/down arrows are landmarks of the possible price direction in the future.
*تعینات کیا مراد ہے مارکیٹ کے تجزیات یہاں ارسال کیے جاتے ہیں جس کا مقصد آپ کی بیداری بڑھانا ہے، لیکن تجارت کرنے کے لئے ہدایات دینا نہیں.
InstaSpot analytical reviews will make you fully aware of market trends! Being an InstaSpot client, you are provided with a large number of free services for efficient trading.


