


ہمارے ٹیم میں 7000000 سے ذائد تاجران شامل ہیں
ہم تجارت کی بہتری کے لئے ہر روز اکھٹے کام کرتے ہیں اور بہترین نتائج حاصل کرتے ہوئے آگے کی جانب بڑھتے ہیں
دُنیا بھر سے سے لاکھوں ہمارے بہترین کام کو سند عطاء کرتے ہیں آپ اپنا انتحاب کریں باقی ہم آپ کی توقعات پر پورا اترنے کے لئے اپنی بہترین کوشش کریں گے
ہم مل کر ایک بہترین ٹیم بناتے ہیں
انسٹا فاریکس آپ سے کام کرتے ہوئے فخر محسوس کرتا ہے


ایکٹر - یو سی ایف 6 ٹورنامنٹ چیمپین اور واقعی ہیرو
ایک فرد کے جس نے اپنا آپ منوایا ہے وہ فرد کہ جو ہماری راہ پر چلا ہے.
ٹکٹا روو کی کامیابی کا راز یہ ہے کہ وہ اپنے اہداف کی جانب مسلسل بڑھتا رہتا ہے
اپنے ہنر یا ٹیلنٹ کے تمام پہلو آشکار کررہے ہیں
پہچانیں ، کوشش کریں ، ناکام ہوں لیکن کبھی نہ رُکیں
انسٹا فاریکس آپ کی کامیابی کی کہاں یہاں سے شروع ہوتی ہے

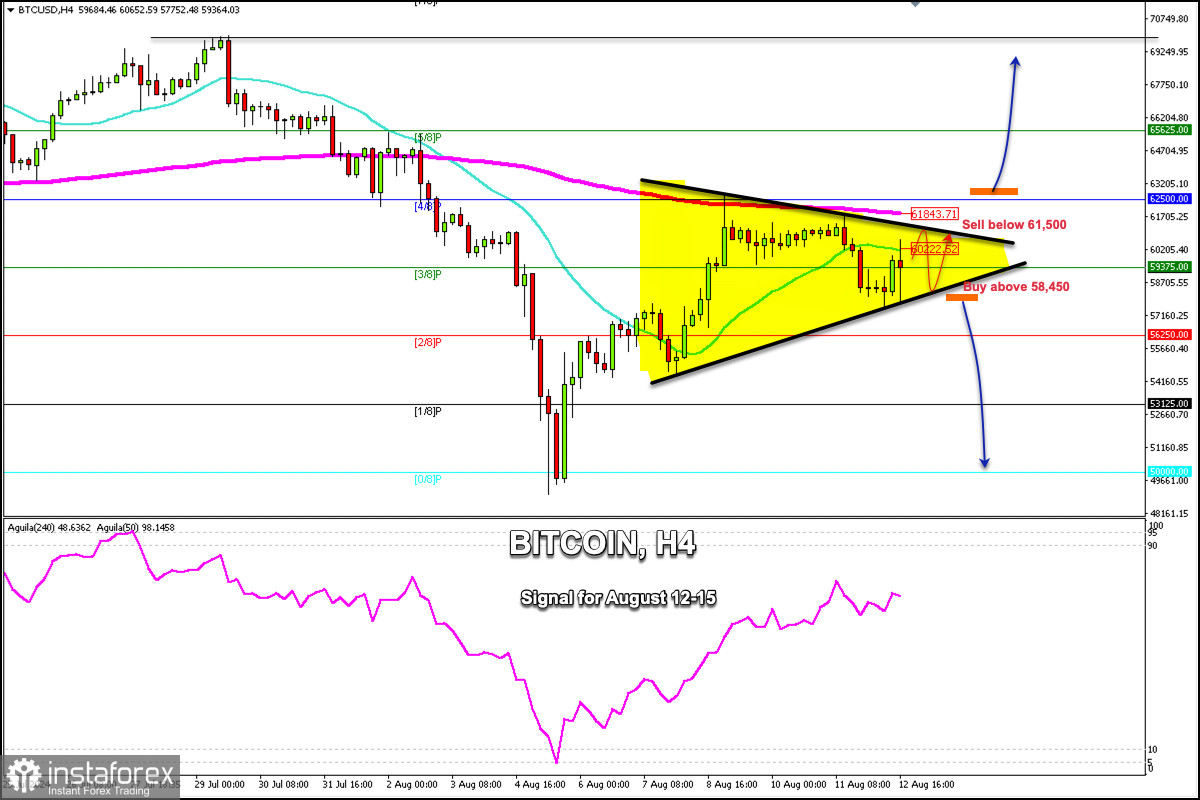
Bitcoin is trading at about 59,375 within a symmetrical triangle pattern forming since August 7. The crypto is likely to consolidate below the 200 EMA and above $58,000.
The BTC price is expected to trade above or around the psychological level of $60,000 in the next few days. Therefore, Bitcoin could be preparing for a bullish or bearish scenario.
The symmetrical triangle pattern could confirm the sideways movement of Bitcoin for the next few days. So, we could look for opportunities to buy in case Bitcoin consolidates above the 200 EMA located at 61,843 and above 4/8 Murray located at 62,500. Then, it could reach the psychological level of $70,000.
In case Bitcoin falls below the pattern, we could expect a trend reversal. The key for the BTC price is to consolidate below $58,000 and even below 6/8 Murray. There is a strong probability that BTC could fall below 56,250. Then, it could reach 0/8 Murray located at $50,000.
Our strategy for the next few days could be to buy and sell Bitcoin within the channel within the symmetrical triangle pattern. On the other hand, whenever BTC trades below 62,500, the outlook will remain negative and we could look for opportunities to sell.
*تعینات کیا مراد ہے مارکیٹ کے تجزیات یہاں ارسال کیے جاتے ہیں جس کا مقصد آپ کی بیداری بڑھانا ہے، لیکن تجارت کرنے کے لئے ہدایات دینا نہیں.
InstaSpot analytical reviews will make you fully aware of market trends! Being an InstaSpot client, you are provided with a large number of free services for efficient trading.


