


ہمارے ٹیم میں 7000000 سے ذائد تاجران شامل ہیں
ہم تجارت کی بہتری کے لئے ہر روز اکھٹے کام کرتے ہیں اور بہترین نتائج حاصل کرتے ہوئے آگے کی جانب بڑھتے ہیں
دُنیا بھر سے سے لاکھوں ہمارے بہترین کام کو سند عطاء کرتے ہیں آپ اپنا انتحاب کریں باقی ہم آپ کی توقعات پر پورا اترنے کے لئے اپنی بہترین کوشش کریں گے
ہم مل کر ایک بہترین ٹیم بناتے ہیں
انسٹا فاریکس آپ سے کام کرتے ہوئے فخر محسوس کرتا ہے


ایکٹر - یو سی ایف 6 ٹورنامنٹ چیمپین اور واقعی ہیرو
ایک فرد کے جس نے اپنا آپ منوایا ہے وہ فرد کہ جو ہماری راہ پر چلا ہے.
ٹکٹا روو کی کامیابی کا راز یہ ہے کہ وہ اپنے اہداف کی جانب مسلسل بڑھتا رہتا ہے
اپنے ہنر یا ٹیلنٹ کے تمام پہلو آشکار کررہے ہیں
پہچانیں ، کوشش کریں ، ناکام ہوں لیکن کبھی نہ رُکیں
انسٹا فاریکس آپ کی کامیابی کی کہاں یہاں سے شروع ہوتی ہے

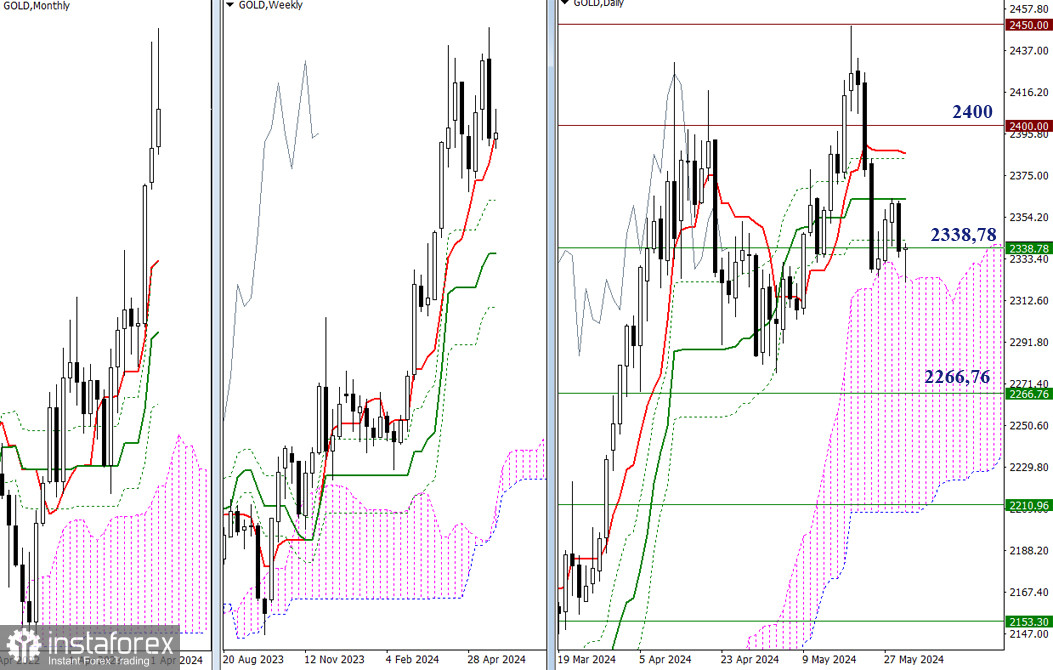
Last week, a prominent candlestick combination, an absorption pattern, was formed. However, we have not seen a confirmation or any progress on the bearish bias. This might be due to the month-end. The bears may summarize the results and return to focusing on strengthening their positions at the start of the new month. To do this, it will be crucial for them to break through the daily cloud, reinforced by weekly support levels (2266.76 – 2210.96). If the bears fail to achieve their goals, the bulls will recover their positions, reclaiming the highs to continue the upward trend. In these conditions, they will face the resistances of the daily Ichimoku cross (2363.17 – 2385.81) and the psychological levels of 2400 and 2450 that were previously tested.
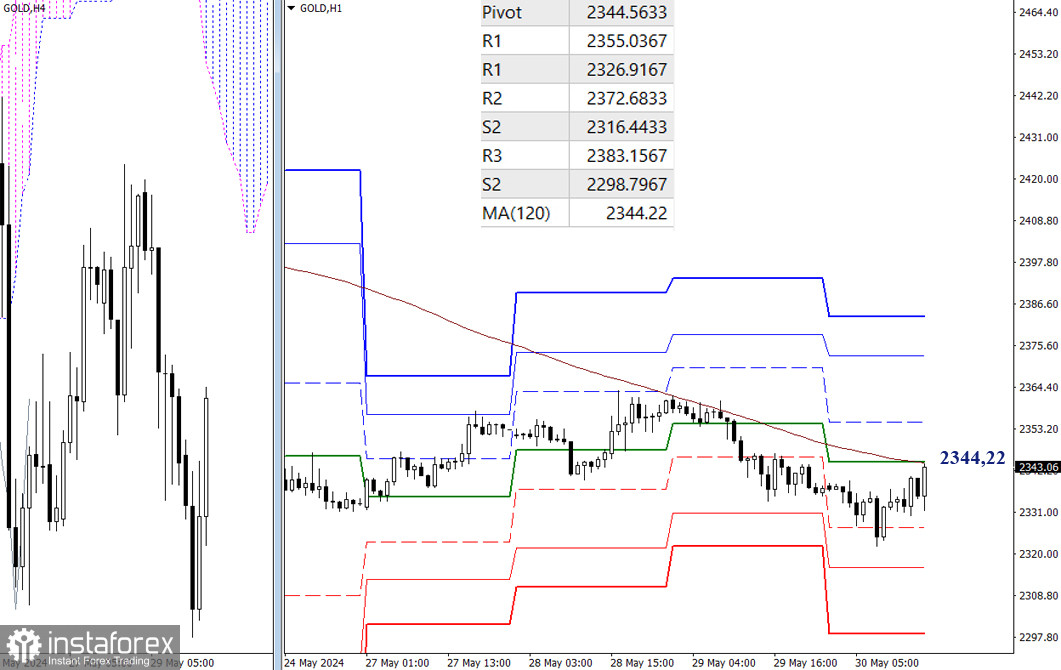
The bears have the main advantage on the lower timeframes. However, the market is closely approaching the resistance of the weekly long-term trend (2344.22). Testing, breaking through, and reversing this level could shift the balance of power in favor of the bulls. In this case, the targets for the upward movement will be the resistances of the classic Pivot levels, currently located at 2355.04, 2372.68, and 2383.16.
If the price bounces off and resumes the decline, it will initially be important to exit the correction zone (2322.06) and then proceed to test the supports of the classic Pivot levels (2316.44 – 2298.80).
***
The technical analysis of the situation uses:
Higher timeframes - Ichimoku Kinko Hyo (9.26.52) + Fibonacci Kijun levels
Lower timeframes - H1 - Pivot Points (classic) + Moving Average 120 (weekly long-term trend)
*تعینات کیا مراد ہے مارکیٹ کے تجزیات یہاں ارسال کیے جاتے ہیں جس کا مقصد آپ کی بیداری بڑھانا ہے، لیکن تجارت کرنے کے لئے ہدایات دینا نہیں.
InstaSpot analytical reviews will make you fully aware of market trends! Being an InstaSpot client, you are provided with a large number of free services for efficient trading.


