


ہمارے ٹیم میں 7000000 سے ذائد تاجران شامل ہیں
ہم تجارت کی بہتری کے لئے ہر روز اکھٹے کام کرتے ہیں اور بہترین نتائج حاصل کرتے ہوئے آگے کی جانب بڑھتے ہیں
دُنیا بھر سے سے لاکھوں ہمارے بہترین کام کو سند عطاء کرتے ہیں آپ اپنا انتحاب کریں باقی ہم آپ کی توقعات پر پورا اترنے کے لئے اپنی بہترین کوشش کریں گے
ہم مل کر ایک بہترین ٹیم بناتے ہیں
انسٹا فاریکس آپ سے کام کرتے ہوئے فخر محسوس کرتا ہے


ایکٹر - یو سی ایف 6 ٹورنامنٹ چیمپین اور واقعی ہیرو
ایک فرد کے جس نے اپنا آپ منوایا ہے وہ فرد کہ جو ہماری راہ پر چلا ہے.
ٹکٹا روو کی کامیابی کا راز یہ ہے کہ وہ اپنے اہداف کی جانب مسلسل بڑھتا رہتا ہے
اپنے ہنر یا ٹیلنٹ کے تمام پہلو آشکار کررہے ہیں
پہچانیں ، کوشش کریں ، ناکام ہوں لیکن کبھی نہ رُکیں
انسٹا فاریکس آپ کی کامیابی کی کہاں یہاں سے شروع ہوتی ہے

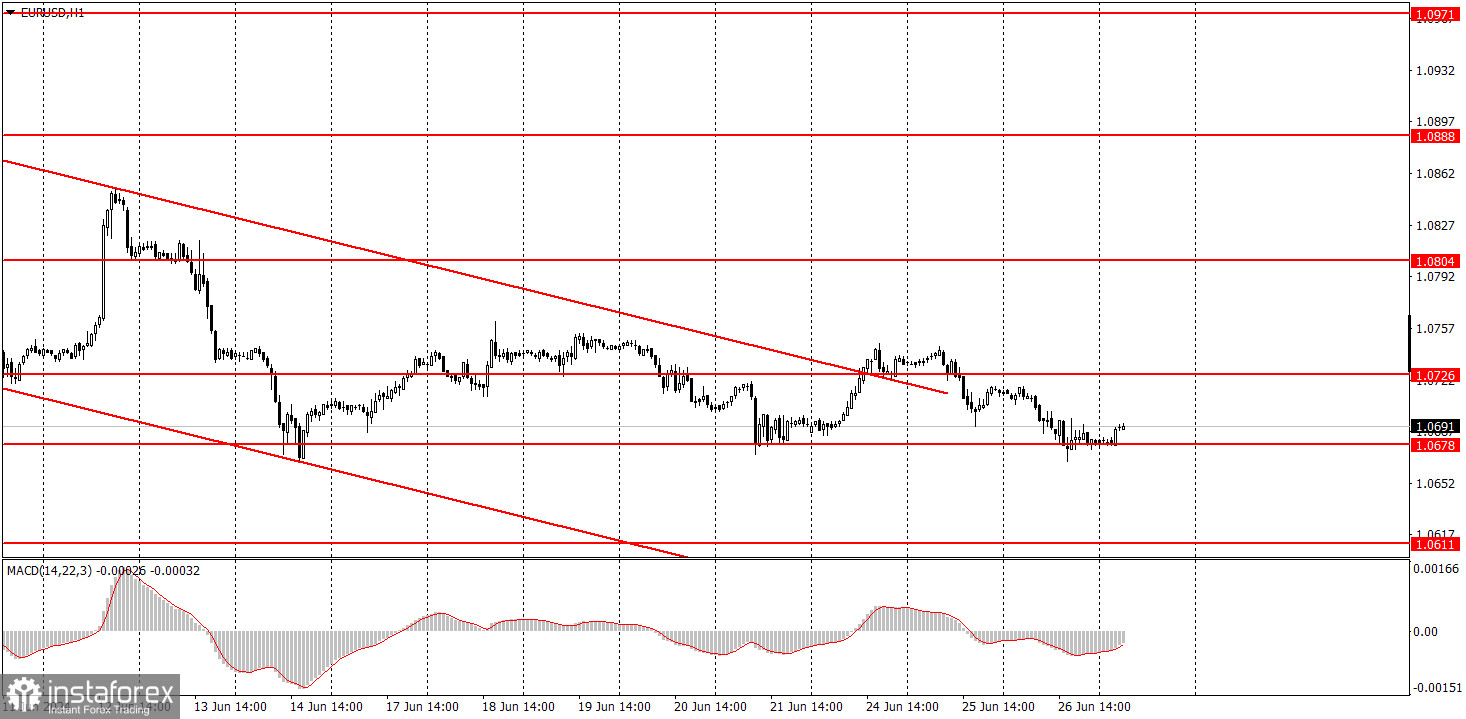
EUR/USD continued a rather sluggish downward movement and by the end of the day, the price approached the level of 1.0678 for the third time. In general, since the first bounce from this level, the pair has been in a flat phase, which means that it has been trading in a sideways channel. Its upper boundary does not correspond to the level of 1.0726; it is slightly higher. Therefore, the third rebound from the level of 1.0678 could trigger a new upward movement within the sideways channel. Conversely, closing below the sideways channel would suggest that the flat phase has ended and the euro will fall further.
Frankly speaking, we believe that the euro will continue to decline in one way or another. The price has been going through a corrective phase for a long time, but the global downward trend remains intact. Therefore, we expect the euro to fall unless this global trend turns the other way. Yesterday, there was no macroeconomic and fundamental background, which explains why volatility was low. However, low volatility has been an integral part of trading for several months now.
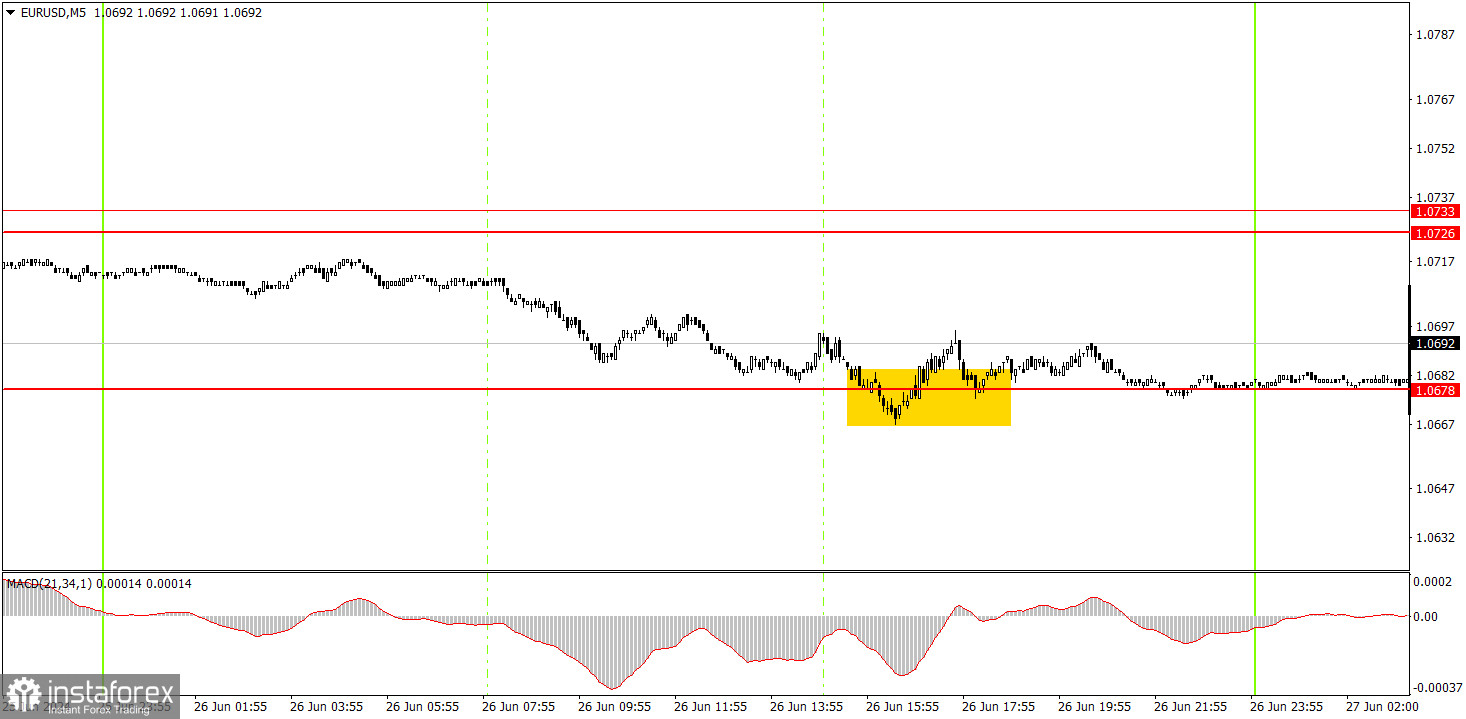
The pair formed only one signal on the 5-minute timeframe - a buy signal. It was quite a weak signal and was so inaccurate that we would not recommend executing it. Just a reminder, in case of a bounce, the rebound should be precise. If it isn't, the strength of such a signal decreases. Moreover, the price approached the level of 1.0678 for the third time, so it has a better chance of breaching this level. In any case, the price failed to move even 10 pips in the intended direction.
On the hourly chart, EUR/USD is forming a local downward trend, but the pair is currently going through a corrective phase and trading within a sideways channel. We still expect the quote to drop to levels like 1.0600, 1.0450, and even 1.0200. However, it's important to understand that the price will not reach these targets immediately; they are medium-term objectives. For instance, the pair could go through a corrective phase for another week, as the price has not breached the level of 1.0678 even after three attempts. Nonetheless, we don't see any reasons for the euro to rise in the medium-term.
On Thursday, traders can expect the downward movement to continue if the price breaks through the level of 1.0678. However, it's important to remember that EUR/USD may show weak and erratic movements.
The key levels on the 5M chart are 1.0483, 1.0526, 1.0568, 1.0611, 1.0678, 1.0726-1.0733, 1.0797-1.0804, 1.0838-1.0856, 1.0888-1.0896, 1.0940, 1.0971-1.0981. Today, there are no noteworthy events in the European Union. The US docket will feature reports on the final estimate of GDP numbers for Q1, durable goods orders, and initial jobless claims. As the saying goes, "any port in the storm."
1) Signal strength is determined by the time taken for its formation (either a bounce or level breach). A shorter formation time indicates a stronger signal.
2) If two or more trades around a certain level are initiated based on false signals, subsequent signals from that level should be disregarded.
3) In a flat market, any currency pair can produce multiple false signals or none at all. In any case, the flat trend is not the best condition for trading.
4) Trading activities are confined between the onset of the European session and mid-way through the U.S. session, after which all open trades should be manually closed.
5) On the 30-minute timeframe, trades based on MACD signals are only advisable amidst substantial volatility and an established trend, confirmed either by a trendline or trend channel.
6) If two levels lie closely together (ranging from 5 to 15 pips apart), they should be considered as a support or resistance zone.
Support and Resistance price levels can serve as targets when buying or selling. You can place Take Profit levels near them.
Red lines represent channels or trend lines, depicting the current market trend and indicating the preferable trading direction.
The MACD(14,22,3) indicator, encompassing both the histogram and signal line, acts as an auxiliary tool and can also be used as a signal source.
Significant speeches and reports (always noted in the news calendar) can profoundly influence the price dynamics. Hence, trading during their release calls for heightened caution. It may be reasonable to exit the market to prevent abrupt price reversals against the prevailing trend.
Beginners should always remember that not every trade will yield profit. Establishing a clear strategy coupled with sound money management is the cornerstone of sustained trading success.
*تعینات کیا مراد ہے مارکیٹ کے تجزیات یہاں ارسال کیے جاتے ہیں جس کا مقصد آپ کی بیداری بڑھانا ہے، لیکن تجارت کرنے کے لئے ہدایات دینا نہیں.
InstaSpot analytical reviews will make you fully aware of market trends! Being an InstaSpot client, you are provided with a large number of free services for efficient trading.


