


ہمارے ٹیم میں 7000000 سے ذائد تاجران شامل ہیں
ہم تجارت کی بہتری کے لئے ہر روز اکھٹے کام کرتے ہیں اور بہترین نتائج حاصل کرتے ہوئے آگے کی جانب بڑھتے ہیں
دُنیا بھر سے سے لاکھوں ہمارے بہترین کام کو سند عطاء کرتے ہیں آپ اپنا انتحاب کریں باقی ہم آپ کی توقعات پر پورا اترنے کے لئے اپنی بہترین کوشش کریں گے
ہم مل کر ایک بہترین ٹیم بناتے ہیں
انسٹا فاریکس آپ سے کام کرتے ہوئے فخر محسوس کرتا ہے


ایکٹر - یو سی ایف 6 ٹورنامنٹ چیمپین اور واقعی ہیرو
ایک فرد کے جس نے اپنا آپ منوایا ہے وہ فرد کہ جو ہماری راہ پر چلا ہے.
ٹکٹا روو کی کامیابی کا راز یہ ہے کہ وہ اپنے اہداف کی جانب مسلسل بڑھتا رہتا ہے
اپنے ہنر یا ٹیلنٹ کے تمام پہلو آشکار کررہے ہیں
پہچانیں ، کوشش کریں ، ناکام ہوں لیکن کبھی نہ رُکیں
انسٹا فاریکس آپ کی کامیابی کی کہاں یہاں سے شروع ہوتی ہے

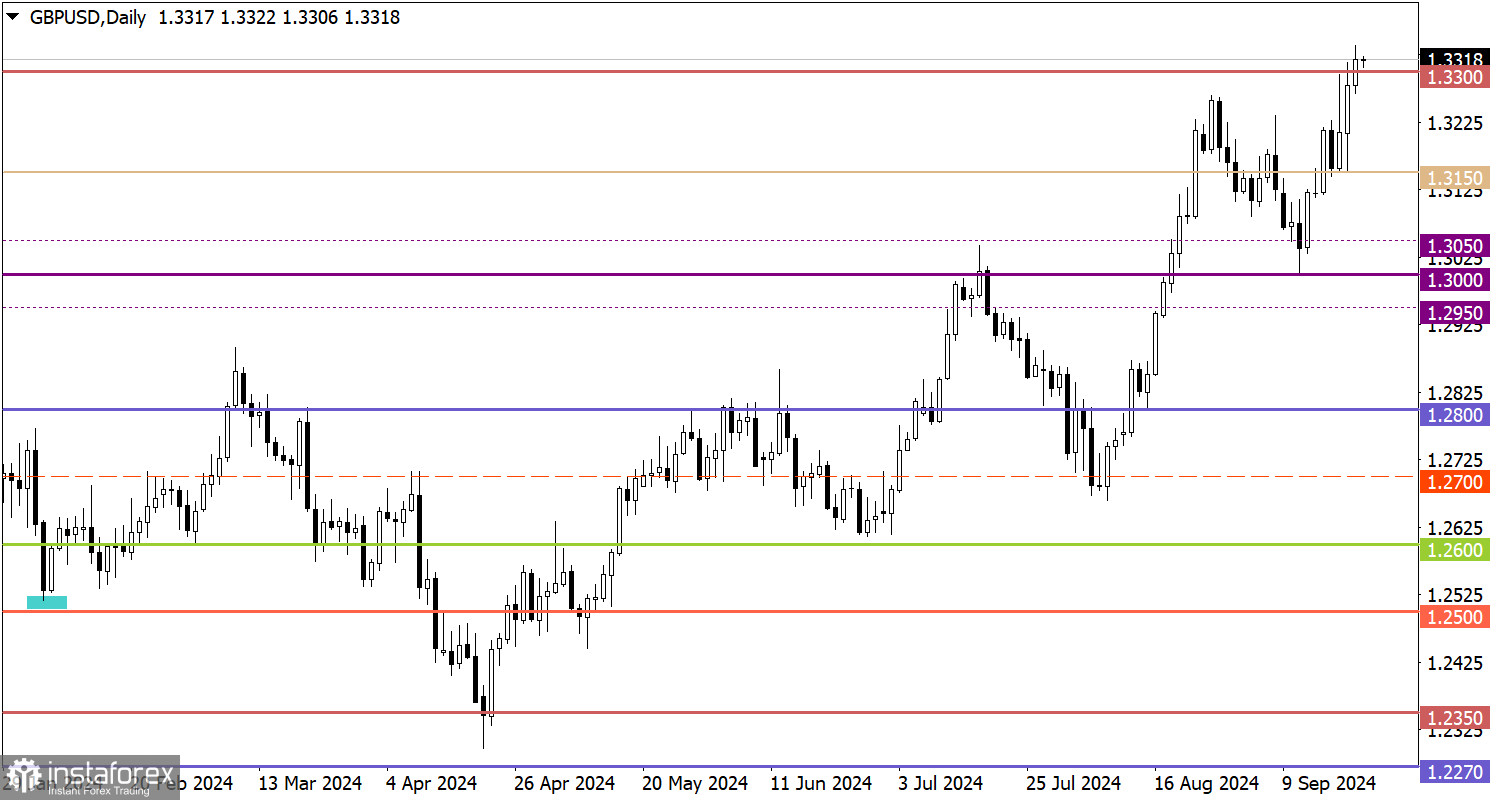
On Friday, the data on retail sales in the UK were published, showing a 1% increase in August. The actual figure significantly exceeded the forecasts of analytical agencies.
The movement around the local high of the mid-term trend indicates a prevailing bullish sentiment among market participants.
The close of the past trading week above the 1.3300 level indicates a prevailing bullish sentiment among market participants, which has already led to an update of the mid-term high.

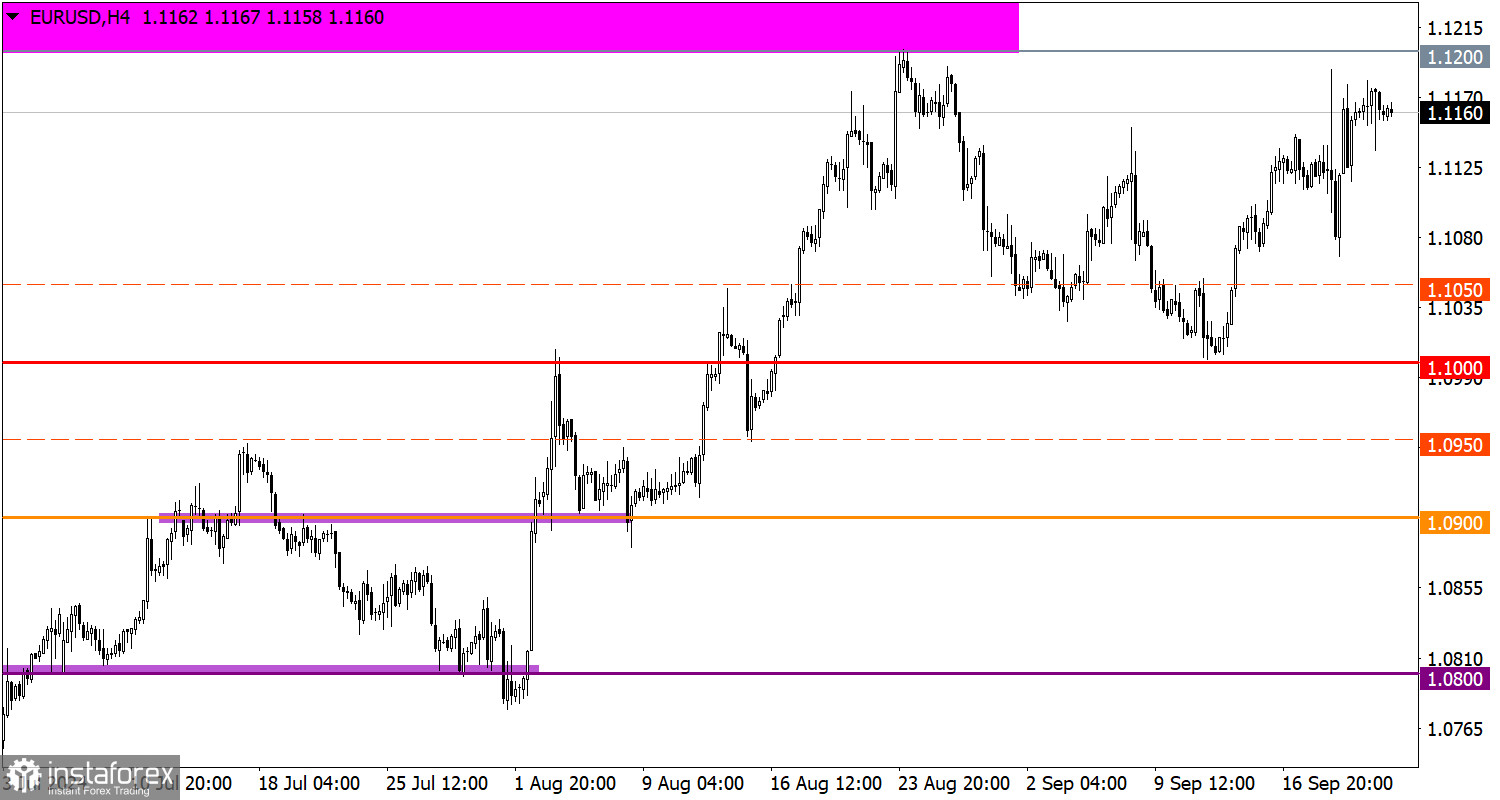
The preliminary estimates of business activity indices are expected to be released today. In the Eurozone and the UK, no significant changes are anticipated for the main indicators, while in the United States, a noticeable decline is projected. Specifically, the composite business activity index in the US is expected to decrease from 54.6 points to 53.0 points.
Considering the potential for further selling of dollar positions in financial markets, the euro's upward momentum could lead the price to reach at least the resistance level of 1.1200/1.1280. For more significant price changes, it will be necessary to stabilize above these levels, which would indicate an update of the mid-term high. Until then, the resistance area will continue to exert pressure on buyers.
The price has stabilized above the 1.3300 level, which indicates the potential for further growth of the British pound. A gradual movement toward the 1.3600 level is possible if the upward cycle remains uninterrupted. However, if the price drops below 1.3300, a temporary stagnation or pullback may occur.
*تعینات کیا مراد ہے مارکیٹ کے تجزیات یہاں ارسال کیے جاتے ہیں جس کا مقصد آپ کی بیداری بڑھانا ہے، لیکن تجارت کرنے کے لئے ہدایات دینا نہیں.
InstaSpot analytical reviews will make you fully aware of market trends! Being an InstaSpot client, you are provided with a large number of free services for efficient trading.


