


ہمارے ٹیم میں 7000000 سے ذائد تاجران شامل ہیں
ہم تجارت کی بہتری کے لئے ہر روز اکھٹے کام کرتے ہیں اور بہترین نتائج حاصل کرتے ہوئے آگے کی جانب بڑھتے ہیں
دُنیا بھر سے سے لاکھوں ہمارے بہترین کام کو سند عطاء کرتے ہیں آپ اپنا انتحاب کریں باقی ہم آپ کی توقعات پر پورا اترنے کے لئے اپنی بہترین کوشش کریں گے
ہم مل کر ایک بہترین ٹیم بناتے ہیں
انسٹا فاریکس آپ سے کام کرتے ہوئے فخر محسوس کرتا ہے


ایکٹر - یو سی ایف 6 ٹورنامنٹ چیمپین اور واقعی ہیرو
ایک فرد کے جس نے اپنا آپ منوایا ہے وہ فرد کہ جو ہماری راہ پر چلا ہے.
ٹکٹا روو کی کامیابی کا راز یہ ہے کہ وہ اپنے اہداف کی جانب مسلسل بڑھتا رہتا ہے
اپنے ہنر یا ٹیلنٹ کے تمام پہلو آشکار کررہے ہیں
پہچانیں ، کوشش کریں ، ناکام ہوں لیکن کبھی نہ رُکیں
انسٹا فاریکس آپ کی کامیابی کی کہاں یہاں سے شروع ہوتی ہے

Yesterday, the S&P 500 stock index posted a solid gain of 1.76%, reaching the target level of 5769 (the low from January 13). At the same time, the signal line of the Marlin oscillator touched the boundary of the uptrend territory.
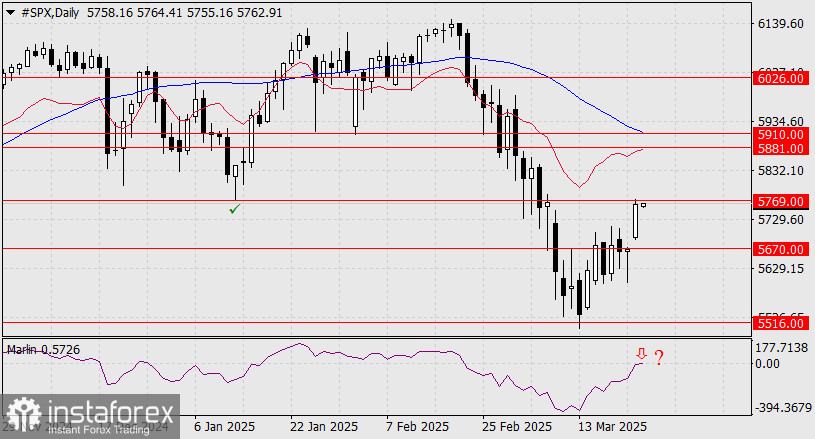
This synchronization in testing key levels marks a bifurcation point—price will either reverse back toward 5516 or continue a rapid rise toward the target range of 5881–5910, where the MACD line is now entering, reinforcing this area. A daily close above 5769 will indicate the continuation of the upward trend. If today's session ends with a bearish candlestick, the bears' first target will be the support level at 5670.
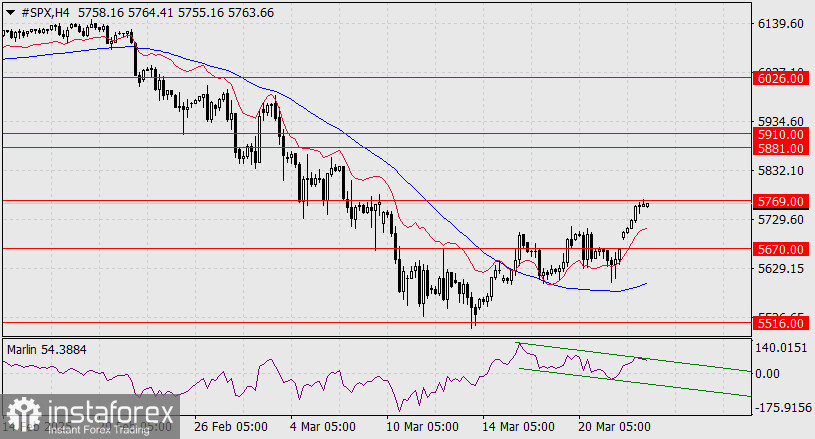
The Marlin oscillator is moving within a descending channel on the four-hour chart. As the oscillator remains in positive territory, a breakout to the upside is certainly possible. Additionally, the MACD line is turning upward, indicating the direction of the short-term trend. The current trend is upward, but confirmation is still needed.
*تعینات کیا مراد ہے مارکیٹ کے تجزیات یہاں ارسال کیے جاتے ہیں جس کا مقصد آپ کی بیداری بڑھانا ہے، لیکن تجارت کرنے کے لئے ہدایات دینا نہیں.
InstaSpot analytical reviews will make you fully aware of market trends! Being an InstaSpot client, you are provided with a large number of free services for efficient trading.


