اصل پیٹرن یعنی ایکچوئل پیٹرن

پیٹرن تصویری صورت یعنی گرافکل ماڈلز ہوتے ہیں جو کہ چارٹ میں قیمت کی جانب سے بنتے ہیں جو کہ ٹیکنیکل تجزیات کے امکانات ، ہسٹری {قیمت کے اتار چڑھاو} چونکہ قیمت اپنے آپ کو دہراتی ہے - جس کا مطلب یہ ہے کہ قیمت کا اتار چڑھا یعنی حرکت ایک جیسے حالات میں ہی عموما مختلف ہوتی ہے جو کہ اس بات کو ممکن بناتی ہے قیمت کے مزید رویہ کی پیشن گوئی کی جاسکے جس کا اُسی طرح ہونے کے امکانات خاصے واضح ہوتے ہیں
انسٹا فاریکس کی "ریلی وینٹ" پیٹرنز نامی سروس استعمال میں بہت ہی آسان ہے جو کہ آپ کو مارکیٹ میں ہونے والی تازہ ترین تبدیلیوں کے حوالے باخبر رکھتے ہیں اور مارکیٹ کے ملنے والے اشاروں پر بر وقت در عمل دینے کے قابل کرتے ہیں - ہماری سہولیات سے آپ ہمیشہ پائیں گے تازہ ترین اور سب سے ذیادہ کار آمد انداز یعنی ریلی وینٹ انداز دستیاب ہوں گے- جو کہ کسی بھی پئیر اور ٹائم فریم کے حوالے سے دستیاب ہوں گے
Double Top
was formed on 31.03 at 16:00:13 (UTC+0)
signal strength 3 of 5
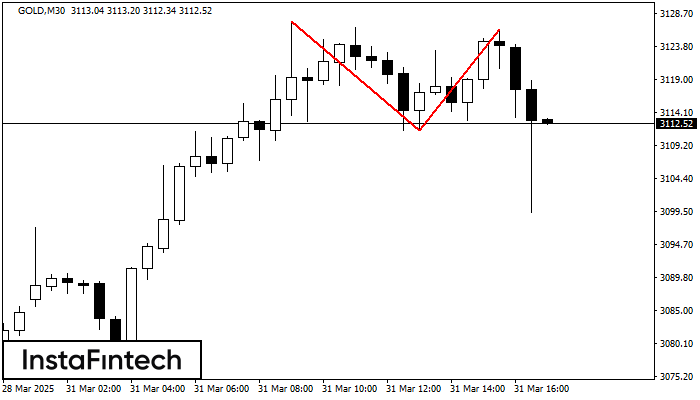
The Double Top reversal pattern has been formed on GOLD M30. Characteristics: the upper boundary 3127.49; the lower boundary 3111.43; the width of the pattern is 1491 points. Sell trades are better to be opened below the lower boundary 3111.43 with a possible movements towards the 3111.13 level.
- All
- All
- Bullish Rectangle
- Bullish Symmetrical Triangle
- Bullish Symmetrical Triangle
- Double Bottom
- Double Top
- Double Top
- Triple Top
- Triple Top
- Triple Top
- Triple Top
- All
- All
- Buy
- Sale
- All
- 1
- 2
- 3
- 4
- 5
Double Top
was formed on 10.04 at 16:00:14 (UTC+0)
signal strength 3 of 5
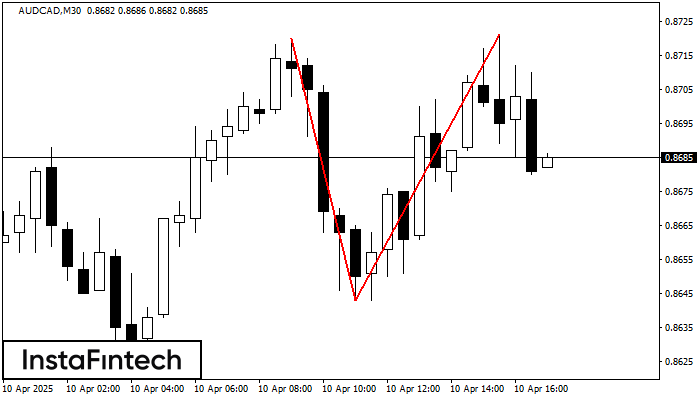
On the chart of AUDCAD M30 the Double Top reversal pattern has been formed. Characteristics: the upper boundary 0.8721; the lower boundary 0.8643; the width of the pattern 78 points
Open chart in a new window
Bearish Rectangle
was formed on 10.04 at 15:50:39 (UTC+0)
signal strength 1 of 5
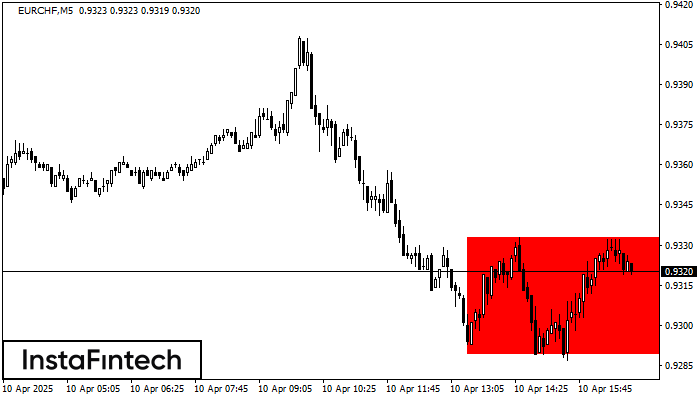
According to the chart of M5, EURCHF formed the Bearish Rectangle. This type of a pattern indicates a trend continuation. It consists of two levels: resistance 0.9333 - 0.0000
The M5 and M15 time frames may have more false entry points.
Open chart in a new window
Double Top
was formed on 10.04 at 15:00:21 (UTC+0)
signal strength 2 of 5
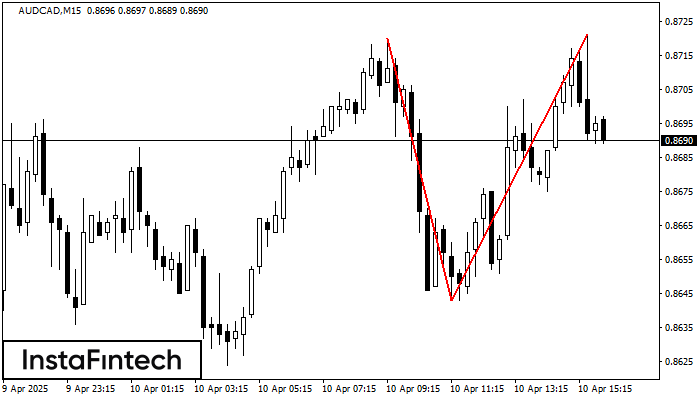
On the chart of AUDCAD M15 the Double Top reversal pattern has been formed. Characteristics: the upper boundary 0.8721; the lower boundary 0.8643; the width of the pattern 78 points
The M5 and M15 time frames may have more false entry points.
Open chart in a new window