


Aktualne wzory

Formacje to modele graficzne, które są tworzone na wykresie przez cenę. Zgodnie z jednym z postulatów analizy technicznej, historia (ruch cen) powtarza się. Oznacza to, że ruchy cen są często podobne w tych samych warunkach, co pozwala z dużym prawdopodobieństwem przewidzieć dalszy rozwój sytuacji.
Formacje od InstaSpot to łatwa w użyciu usługa, która pozwoli Ci być na bieżąco z najnowszymi zmianami rynkowymi i szybko reagować na pojawiające się wskazówki. W naszym serwisie zawsze znajdziesz najnowsze i najistotniejsze formacje dla każdej pary i w dowolnych ramach czasowych.
Double Bottom
was formed on 03.04 at 03:15:07 (UTC+0)
signal strength 1 of 5
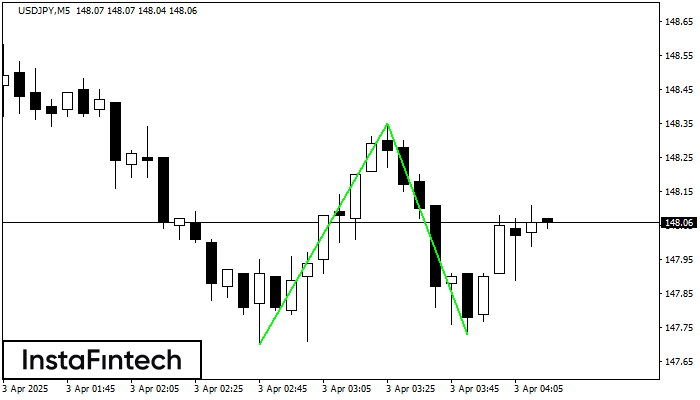
The Double Bottom pattern has been formed on USDJPY M5. This formation signals a reversal of the trend from downwards to upwards. The signal is that a buy trade should be opened after the upper boundary of the pattern 148.35 is broken. The further movements will rely on the width of the current pattern 65 points.
The M5 and M15 time frames may have more false entry points.
- Wszystko
- Wszystko
- Bullish Rectangle
- Bullish Symmetrical Triangle
- Bullish Symmetrical Triangle
- Double Bottom
- Double Top
- Double Top
- Triple Top
- Triple Top
- Triple Top
- Triple Top
- Wszystko
- Kupno
- Sprzedaż
- Wszystko
- Wszystko
- 1
- 2
- 3
- 4
- 5
Bearish Symmetrical Triangle
was formed on 21.04 at 13:29:27 (UTC+0)
signal strength 1 of 5

According to the chart of M5, AUDCHF formed the Bearish Symmetrical Triangle pattern. Description: The lower border is 0.5164/0.5181 and upper border is 0.5203/0.5181. The pattern width is measured
The M5 and M15 time frames may have more false entry points.
Open chart in a new window
Triple Top
was formed on 21.04 at 12:40:05 (UTC+0)
signal strength 1 of 5

On the chart of the GOLD M5 trading instrument, the Triple Top pattern that signals a trend change has formed. It is possible that after formation of the third peak
The M5 and M15 time frames may have more false entry points.
Open chart in a new window
Bearish Symmetrical Triangle
was formed on 21.04 at 12:20:58 (UTC+0)
signal strength 1 of 5

According to the chart of M5, GBPCHF formed the Bearish Symmetrical Triangle pattern. Trading recommendations: A breach of the lower border 1.0783 is likely to encourage a continuation
The M5 and M15 time frames may have more false entry points.
Open chart in a new window

