


A lenda da equipe InstaSpot!
Lenda! Você acha que isso é retórica bombástica? Mas como devemos chamar um homem que se tornou o primeiro asiático a vencer o campeonato mundial de xadrez aos 18 anos e que se tornou o primeiro grande mestre indiano aos 19? Esse foi o começo de um caminho difícil para o título de campeão do mundo para Viswanathan Anand, o homem que se tornou parte da história do xadrez para sempre. Agora mais uma lenda na equipe InstaSpot!


O Borussia é um dos clubes de futebol com mais títulos da Alemanha, que provou repetidamente aos fãs: o espírito de competição e liderança certamente levará ao sucesso. Negocie da mesma maneira que os profissionais do esporte jogam: com confiança e ativamente. Mantenha o "ritmo" do Borussia FC e esteja na liderança com a InstaSpot!
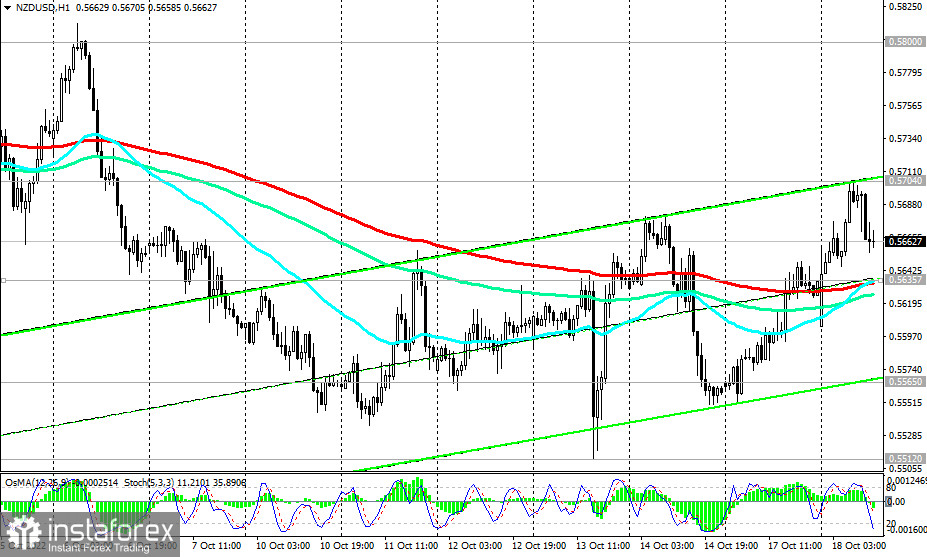
Today, NZD/USD half retains the bullish momentum gained from the inflation data in New Zealand that exceeded the forecast, while also trying to stay in the zone above the short-term important support level of 0.5635 (200 EMA on the 1-hour chart). As of writing, the pair is trading near the 0.5662 mark. It is characteristic that the OsMA and Stochastic technical indicators paint a contradictory picture: on the daily and weekly charts they turn to long positions, and on the 1-hour and 4-hour charts they turn to short positions, signaling the end of the upward correction.
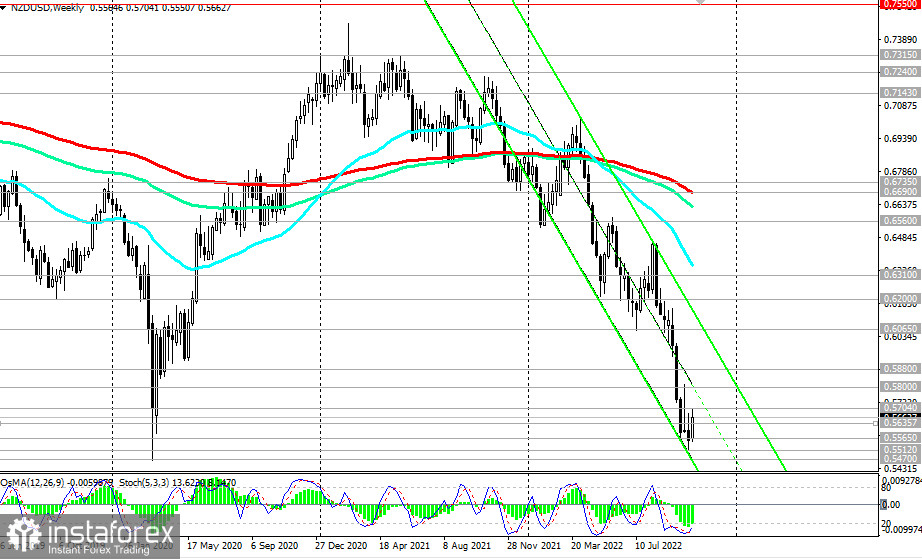
The signal for the resumption of sales will be a breakdown of the support level of 0.5635. In this case, NZD/USD will head deeper into the descending channel on the weekly chart and towards 0.5470.
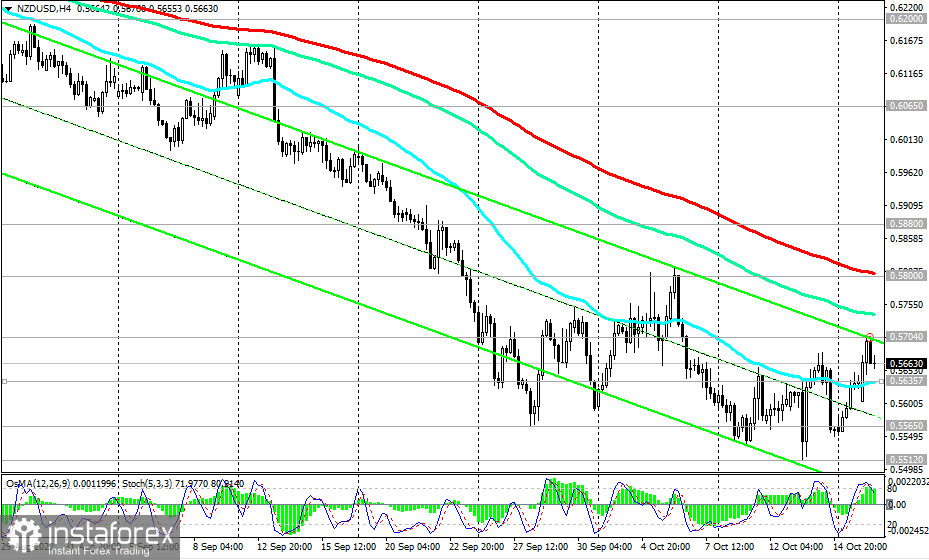
In an alternative scenario, the upward correction will continue to the resistance levels of 0.5800 (200 EMA on the 4-hour chart), 0.5880 (50 EMA on the daily chart).
In general, the downward dynamics of NZD/USD prevails, while the pair remains in the zone of a long-term bear market—below the key resistance levels of 0.6690 (200 EMA on the weekly chart), 0.6310 (200 EMA on the daily chart). Only their breakdown will bring the pair back into the zone of a long-term bull market.
And today, the volatility in the NZD/USD pair may increase again (in the period after 13:15 - 14:00 GMT), which will be associated with the publication of macro statistics for the US and New Zealand, as well as at 21:30 during the speech of Fed representative Neel Kashkari.
Support levels: 0.5635, 0.5600, 0.5565, 0.5512, 0.5470
Resistance levels: 0.5704, 0.5800, 0.5880, 0.6065, 0.6200, 0.6310, 0.6560, 0.6690, 0.6735
Trading Tips
Sell Stop 0.5620. Stop-Loss 0.5710. Take-Profit 0.5600, 0.5565, 0.5512, 0.5470
Buy Stop 0.5710. Stop-Loss 0.56250. Take-Profit 0.5800, 0.5880, 0.6065, 0.6200, 0.6310, 0.6560, 0.6690, 0.6735
*A análise de mercado aqui postada destina-se a aumentar o seu conhecimento, mas não dar instruções para fazer uma negociação.
InstaSpot analytical reviews will make you fully aware of market trends! Being an InstaSpot client, you are provided with a large number of free services for efficient trading.


