


Nossa equipe tem mais de 7,000,000 traders!
Todos os dias, trabalhamos juntos para melhorar a negociação. Obtivemos resultados elevados e avançamos.
O reconhecimento de milhões de traders em todo o mundo é a melhor apreciação do nosso trabalho! Você nos escolheu e faremos tudo o que for necessário para atender às suas expectativas!
Nós somos uma ótima equipe juntos!
InstaSpot. Orgulho de trabalhar para você!


Ator, hexacampeão do UFC e um verdadeiro herói!
Um homem de sucesso. Um homem que mostra o nosso caminho.
O segredo por trás do sucesso de Taktarov é um movimento constante em direção ao objetivo.
Revele todos os lados do seu talento!
Descubra, tente, falhe, mas nunca pare!
I InstaSpot. Sua história de sucesso começa aqui!
EUR/USD faced a bit of pressure on Tuesday, as we predicted the day before. To be precise, after two bounces from the 1.0678 level, a bullish correction was inevitable. This week's economic calendar does not contain any significant events. This means that the market will have nothing to react to. On Monday, the pair rose; on Tuesday, it fell; and on Wednesday, it may rise again. These movements are not tied to any logic, as they are all market noise, flat, or part of a correction. You can try to execute these movements on the 5-minute timeframe, but bear in mind that volatility remains extremely low.
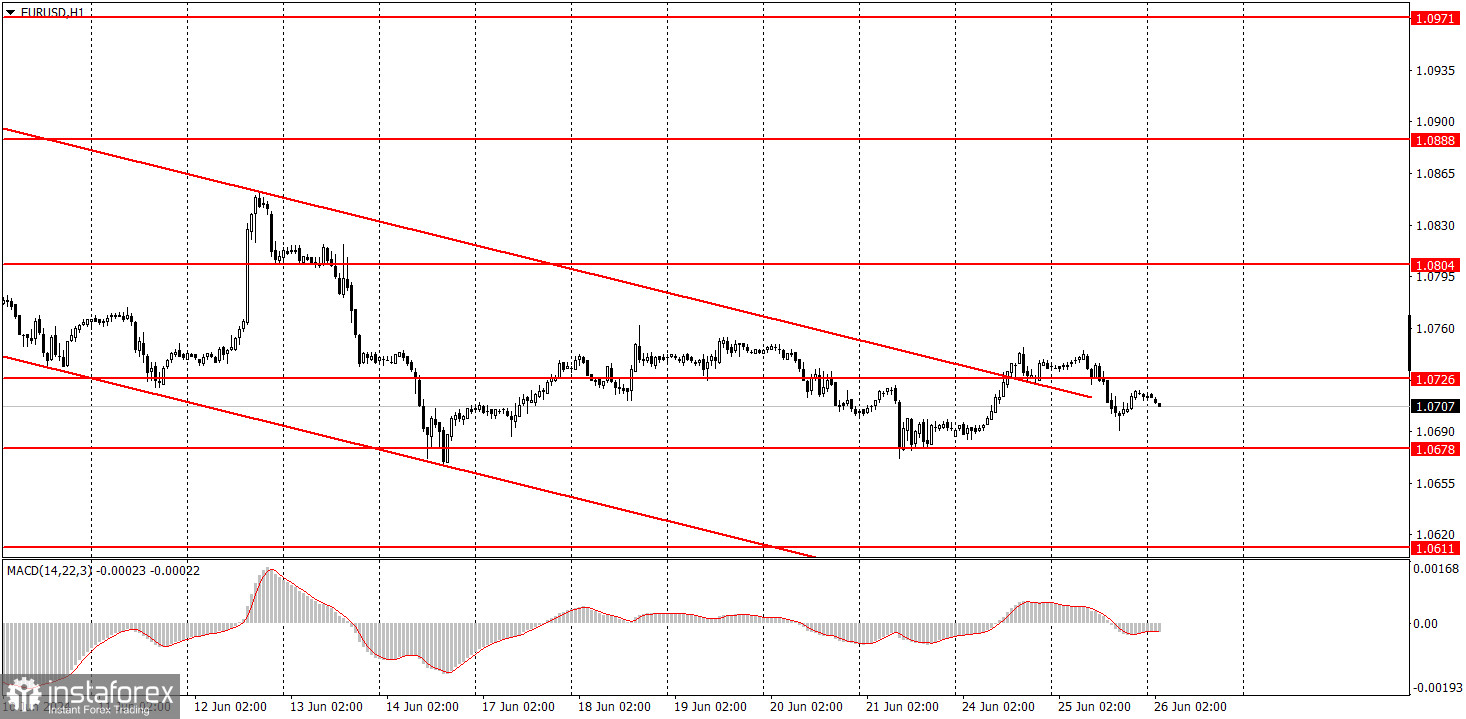
As already mentioned, there were no significant events in the US or the Eurozone. The fact that the price left the descending channel does not mean that the downward trend is over. This is a common mistake among novice traders. If the price breaches the 1.0678 level, the euro will continue to decline. And we are expecting the single currency to fall.
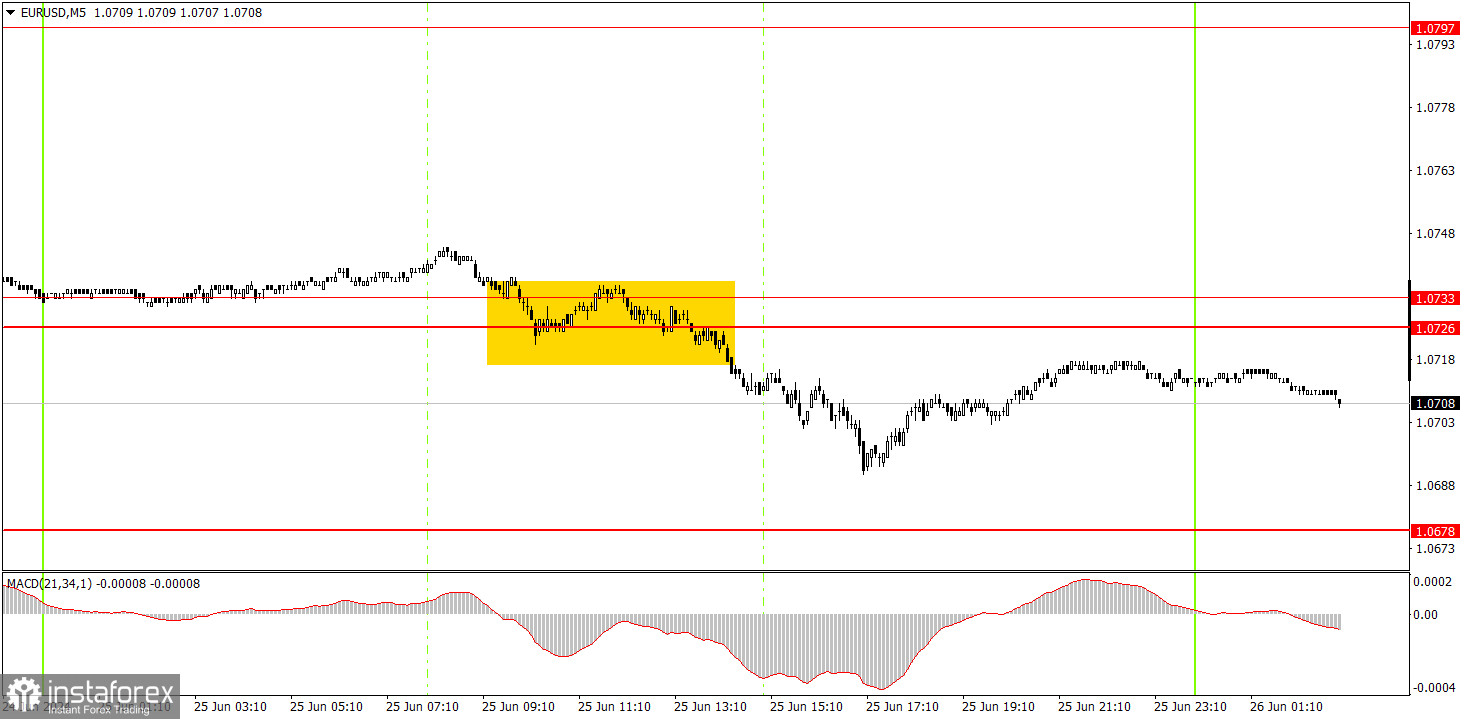
A sell signal was formed on the 5-minute timeframe when the price consolidated below the 1.0726-1.0733 area. Subsequently, the price fell by about 20 pips at its peak, which novice traders could have captured if they managed to close the trade manually. Once again, be mindful of the fact that the pair's movements are very weak right now, and the price couldn't even reach the nearest target level within the day.
On the hourly chart, EUR/USD finally started to form a local downward trend, but the pair is currently going through a correction. We still expect the quote to drop to levels of 1.0600, 1.0450, and even 1.0200. However, it's important to understand that the price will not reach these targets immediately; they are medium-term objectives. For instance, the pair could go through a corrective phase for another week, as the price has not breached the level of 1.0678 even after two attempts. We don't see any reasons for the euro to rise in the medium-term.
On Wednesday, traders can expect the downward movement to continue since the price breached the 1.0726-1.0733 area. However, it's important to remember that EUR/USD may show erratic movements.
The key levels on the 5M chart are 1.0483, 1.0526, 1.0568, 1.0611, 1.0678, 1.0726-1.0733, 1.0797-1.0804, 1.0838-1.0856, 1.0888-1.0896, 1.0940, and 1.0971-1.0981. No significant events or reports are scheduled for Wednesday. Germany will release the consumer sentiment index, and the US docket will feature a report on new home sales. Both reports are of secondary importance.
1) Signal strength is determined by the time taken for its formation (either a bounce or level breach). A shorter formation time indicates a stronger signal.
2) If two or more trades around a certain level are initiated based on false signals, subsequent signals from that level should be disregarded.
3) In a flat market, any currency pair can produce multiple false signals or none at all. In any case, the flat trend is not the best condition for trading.
4) Trading activities are confined between the onset of the European session and mid-way through the U.S. session, after which all open trades should be manually closed.
5) On the 30-minute timeframe, trades based on MACD signals are only advisable amidst substantial volatility and an established trend, confirmed either by a trendline or trend channel.
6) If two levels lie closely together (ranging from 5 to 15 pips apart), they should be considered as a support or resistance zone.
Support and Resistance price levels can serve as targets when buying or selling. You can place Take Profit levels near them.
Red lines represent channels or trend lines, depicting the current market trend and indicating the preferable trading direction.
The MACD(14,22,3) indicator, encompassing both the histogram and signal line, acts as an auxiliary tool and can also be used as a signal source.
Significant speeches and reports (always noted in the news calendar) can profoundly influence the price dynamics. Hence, trading during their release calls for heightened caution. It may be reasonable to exit the market to prevent abrupt price reversals against the prevailing trend.
Beginners should always remember that not every trade will yield profit. Establishing a clear strategy coupled with sound money management is the cornerstone of sustained trading success.
*A análise de mercado aqui postada destina-se a aumentar o seu conhecimento, mas não dar instruções para fazer uma negociação.
InstaSpot analytical reviews will make you fully aware of market trends! Being an InstaSpot client, you are provided with a large number of free services for efficient trading.


