


Nossa equipe tem mais de 7,000,000 traders!
Todos os dias, trabalhamos juntos para melhorar a negociação. Obtivemos resultados elevados e avançamos.
O reconhecimento de milhões de traders em todo o mundo é a melhor apreciação do nosso trabalho! Você nos escolheu e faremos tudo o que for necessário para atender às suas expectativas!
Nós somos uma ótima equipe juntos!
InstaSpot. Orgulho de trabalhar para você!


Ator, hexacampeão do UFC e um verdadeiro herói!
Um homem de sucesso. Um homem que mostra o nosso caminho.
O segredo por trás do sucesso de Taktarov é um movimento constante em direção ao objetivo.
Revele todos os lados do seu talento!
Descubra, tente, falhe, mas nunca pare!
I InstaSpot. Sua história de sucesso começa aqui!
The EUR/USD currency pair continues its near-freefall decline. Yesterday, the European Central Bank meeting took place, where the decision was made to lower all three key rates by 0.25%. This was unsurprising to the market, as it had anticipated such a decision. Nevertheless, this provided a solid reason for the euro to fall again. It's worth noting that the market often prices in events it already knows about in advance. ECB representatives started discussing the possibility of a rate cut in October about two weeks ago. So why did the euro continue to fall today?
It has been falling for the past three weeks for the same reason. The market had been pricing in the Federal Reserve's monetary easing for two years and eventually fully priced it in. With the U.S. policy easing fully accounted for, no more factors are pushing the dollar down. Monetary policy has little to do with it. The market has long understood that the ECB would lower rates just as the Fed did. There was simply no other option.
Thus, the euro continues its decline and can move downward calmly, as we have been saying throughout 2024. Christine Lagarde hinted that another rate cut might occur in December, given the weak economic growth in the Eurozone. Therefore, the euro received further grounds for sustained decline. The target of 1.0463, which we have discussed all year, no longer seems far-fetched.
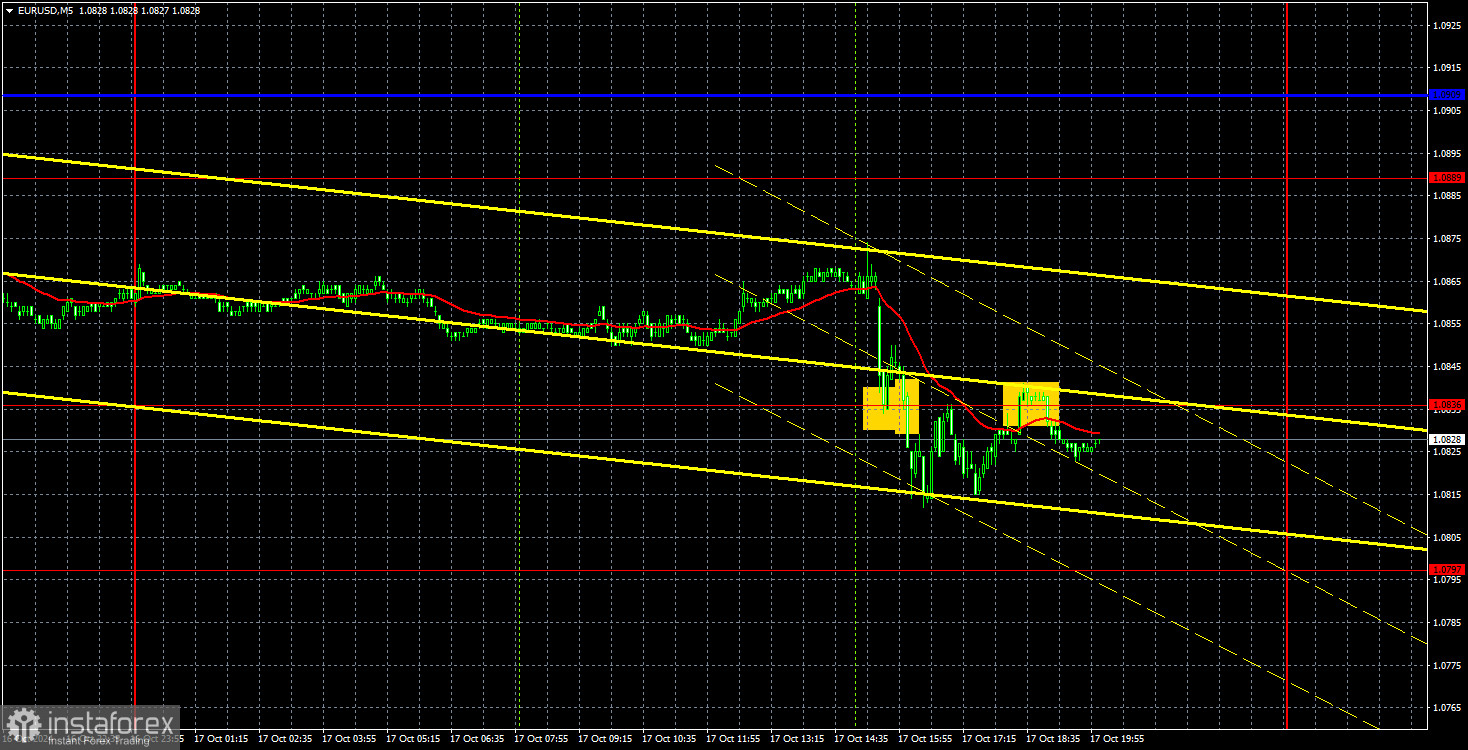
On Thursday, two trading signals formed around the 1.0836 level. The first signal wasn't feasible to act on and didn't make sense, as it appeared right after the ECB meeting. The second—rebound from the 1.0836 level—could have been used for a short position, but volatility remained low even today. The euro is falling in the same style it rose for more than a year—gradually, without rushing, and steadily every day.
The latest COT report is dated October 1. As shown in the illustration, the net position of non-commercial traders has long been in the bullish zone. The bears' attempt to gain dominance failed spectacularly. The net position of non-commercial traders (red line) decreased in the second half of 2023 and early 2024, while commercial traders' (blue line) positions were growing. At the moment, professional traders are once again increasing their long positions.
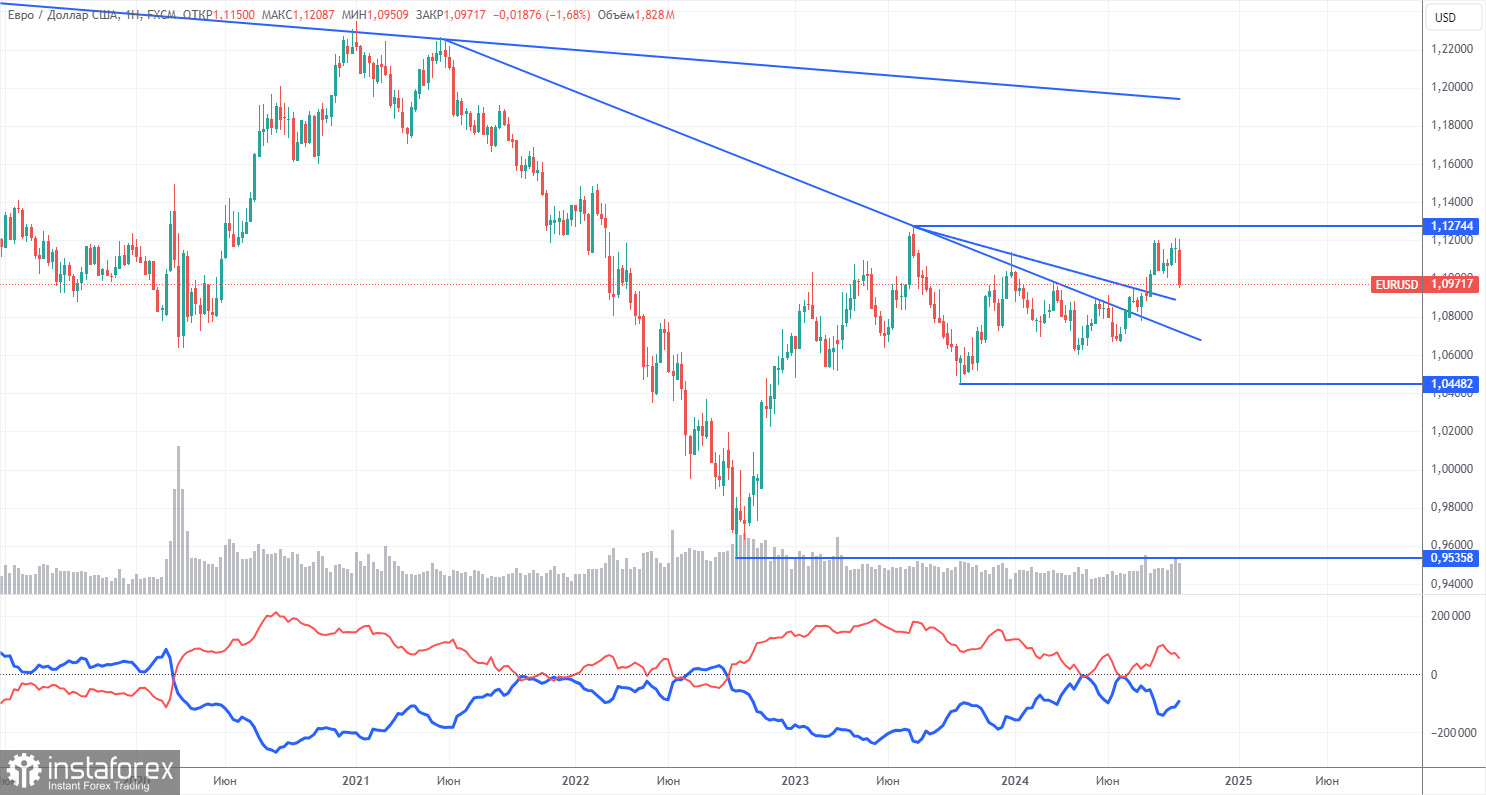
We still don't see any fundamental factors supporting the strengthening of the euro, and technical analysis shows that the price remains in a consolidation zone or flat. On the weekly time frame, it's evident that since December 2022, the pair has been trading between levels 1.0448 and 1.1274. In other words, we have moved from a seven-month flat into an 18-month flat.
The red and blue lines are diverging, indicating an increase in long positions on the euro. However, within the context of a flat, such changes cannot form the basis for long-term conclusions. In the most recent reporting week, long positions for the non-commercial group decreased by 9,500, while short positions increased by 6,800. Accordingly, the net position fell by 16,300. The potential for a decline in the euro remains strong.
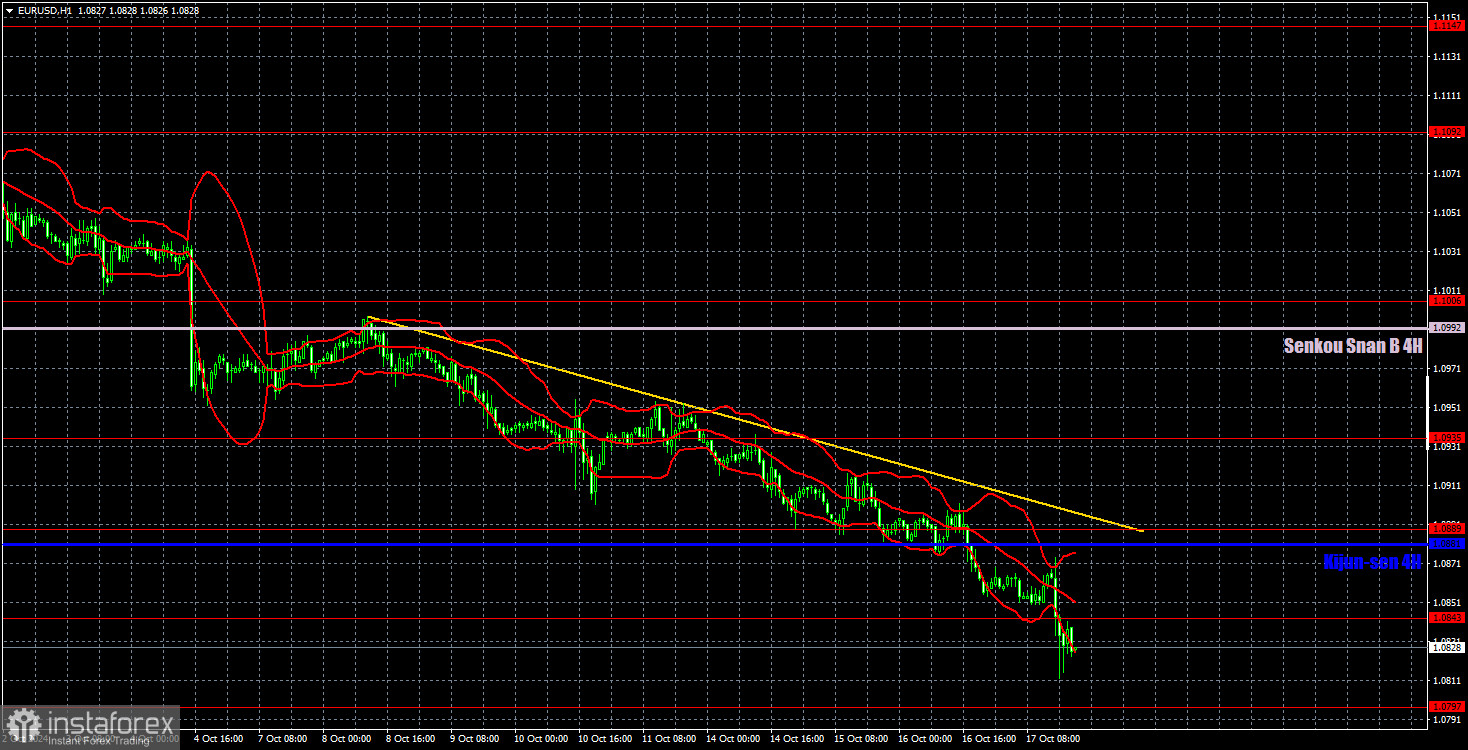
In the hourly time frame, the pair continues its downward movement, which could be the beginning of a new, prolonged downtrend. There's no point in discussing the fundamental and macroeconomic reasons for a potential new decline in the dollar—they simply don't exist. In the medium-term perspective, we expect nothing but a decline. In the short term, a correction is possible, but it would require at least a consolidation above the trendline.
For October 18, we highlight the following trading levels—1.0658-1.0669, 1.0757, 1.0797, 1.0843, 1.0889, 1.0935, 1.1006, 1.1092, 1.1147, 1.1185, 1.1234, 1.1274, as well as the Senkou Span B line (1.0992) and the Kijun-sen line (1.0881). The Ichimoku indicator lines may shift throughout the day, so this should be considered when determining trading signals. Remember to set a Stop Loss to break even if the price moves 15 pips in the intended direction. This helps protect against potential losses if the signal turns out to be false.
No significant events are scheduled in the Eurozone on Friday. In the U.S., only two minor reports are expected, which is unlikely to affect the overall trend. As a result, the euro may also continue its gradual decline today.
Support and Resistance Levels: Thick red lines near which price movement may end. They are not sources of trading signals.
Kijun-sen and Senkou Span B Lines: Ichimoku indicator lines transferred to the hourly time frame from the 4-hour chart. They are strong lines.
Extremes Levels: Thin red lines from which the price has previously bounced. They serve as sources of trading signals.
Yellow Lines: Trend lines, trend channels, and any other technical patterns.
Indicator 1 on COT charts: The size of the net position for each category of traders.
*A análise de mercado aqui postada destina-se a aumentar o seu conhecimento, mas não dar instruções para fazer uma negociação.
InstaSpot analytical reviews will make you fully aware of market trends! Being an InstaSpot client, you are provided with a large number of free services for efficient trading.


