


Modelele sunt reprezentări ce sunt formate de preț într-un grafic. Conform unuia dintre postulatele analizei tehnice, istoria (evoluția prețurilor) se repetă. Înseamnă că evoluția prețurilor este adesea similară în aceleași situații, ceea ce face posibilă prezicerea dezvoltării ulterioare a situației cu o probabilitate ridicată.
Tiparele relevante dezvoltate de InstaSpot reprezintă un serviciu ușor de utilizat, care vă permite să fiți la curent cu ultimele schimbări pe piață și să reacționați la indicii de pe piață în timp. În serviciul nostru veți găsi întotdeauna cele mai recente și cele mai relevante modele pentru orice pereche și orice interval de timp.
Bullish Symmetrical Triangle
was formed on 19.03 at 18:02:02 (UTC+0)
signal strength 3 of 5
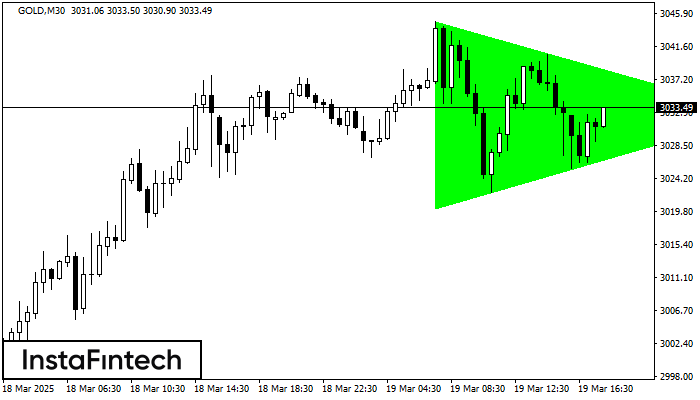
According to the chart of M30, GOLD formed the Bullish Symmetrical Triangle pattern, which signals the trend will continue. Description. The upper border of the pattern touches the coordinates 3044.87/3032.56 whereas the lower border goes across 3020.18/3032.56. The pattern width is measured on the chart at 2469 pips. If the Bullish Symmetrical Triangle pattern is in progress during the upward trend, this indicates the current trend will go on. In case 3032.56 is broken, the price could continue its move toward 3032.86.


