


Naš tim čini više od 7.000.000 trgovaca!
Svakog dana zajedno radimo na unapređenju trgovanja. Ostvarujemo vrhunske rezultate i krećemo se samo napred.
Priznatost od strane miliona trgovaca širom sveta najbolje pokazuje koliko se naš rad ceni! Napravili ste svoj izbor i mi ćemo učiniti sve što je neophodno da zadovoljimo vaša očekivanja!
Zajedno činimo sjajan tim!
InstaSpot. Sa ponosom radi za Vas!


Glumac, šampion UFC turnira i pravi heroj!
Čovek koji je ostvario sebe. Čovek koji hoda uz nas.
Tajna uspeha Taktarova jeste stalno kretanje ka svom cilju.
Otkrijte sve strane svog talenta!
Istražuj, pokušaj, padni - ali se nikad ne zaustavljaj!
InstaSpot. Priča Vašeg uspeha započinje ovde!

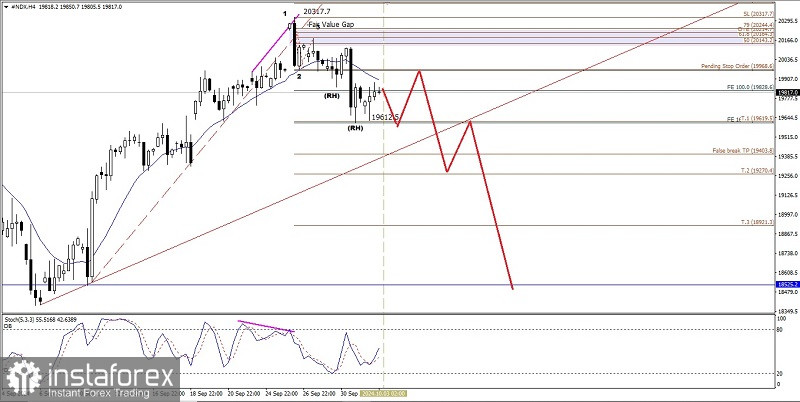
From what we see on the 4-hour chart of the Nasdaq 100 index, there appears to be a deviation between the price movement of the index and the Stochastic Oscillator indicator which is also confirmed by the appearance of a Bearish 123 pattern followed by 2 Bearish Ross Hook (RH) and its price movement moving below the EMA 21 which also has a decreasing slope so that based on these facts in the near future #NDX has the potential to weaken down where the level of 19612.5 will be tested in the near future as long as it does not strengthen again to break and close above the level of 20317.7 then #NDX has the potential to weaken down to the level of 19270.4 and has the potential to continue its weakening to the level of 18525.2 if the momentum and volatility support it.
(Disclaimer)
*Analiza tržišta koja se ovde nalazi namenjena je boljem razumevanju tržišta i ne pruža instrukcije za vršenje trgovanja.
Uz InstaSpot-ove analitičke preglede uvek ćete biti u toku sa tržišnim trendovima! Klijentima InstaSpot-a su dostupni mnogobrojni besplatni servisi za uspešno trgovanje.


