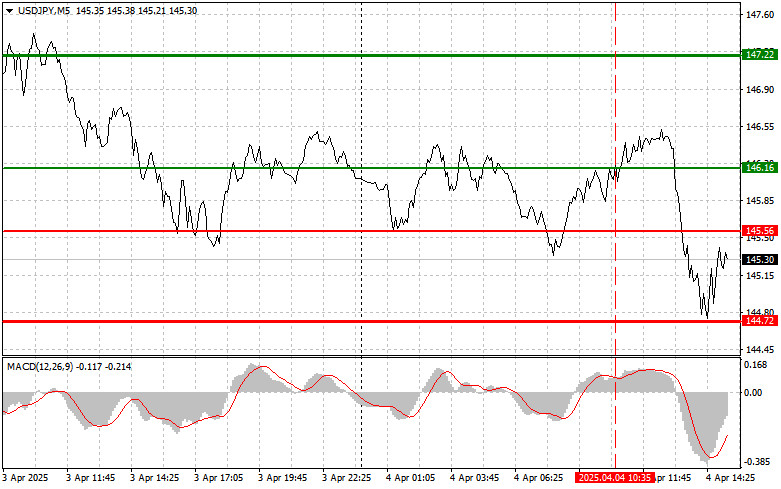
- The price test of 146.16 occurred at a moment when the MACD indicator had already moved significantly above the zero line, which limited the pair's upward potential within a bearish
Autor: Jakub Novak
20:08 2025-04-04 UTC+2
63
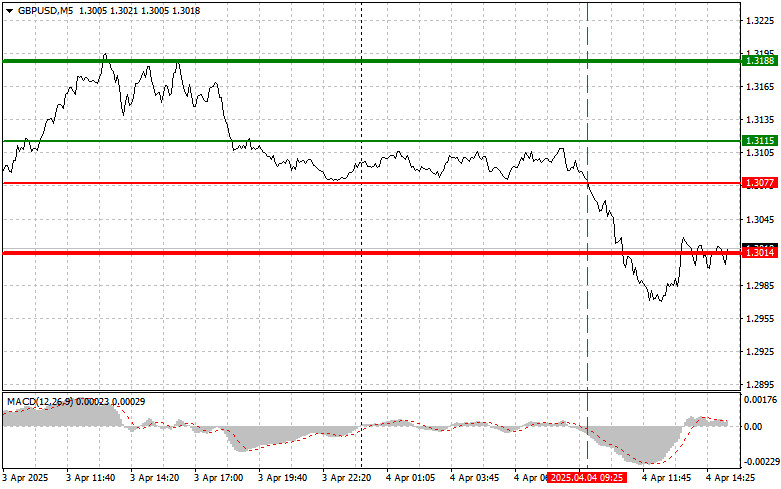
The price test of 1.3077 occurred at a time when the MACD indicator had already moved significantly below the zero line, which limited the pair's further downward potential. Following recentAutor: Jakub Novak
20:03 2025-04-04 UTC+2
37
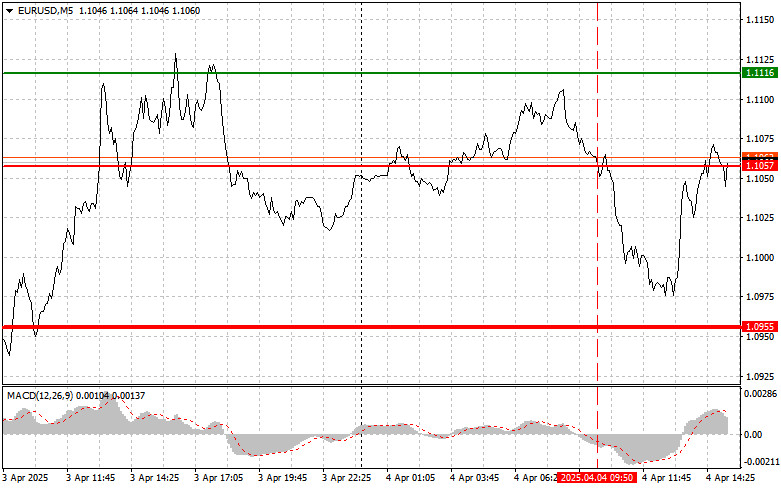
The price test of 1.1050 occurred at a time when the MACD indicator had already moved significantly below the zero line, limiting the pair's downward potential. For this reasonAutor: Jakub Novak
20:00 2025-04-04 UTC+2
43
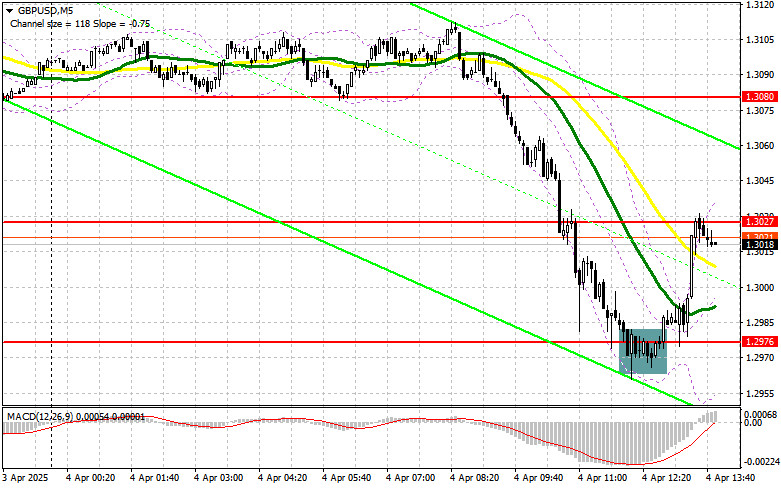
- In my morning forecast, I highlighted the level of 1.2976 and planned to base market entry decisions around it. Let's look at the 5-minute chart to see what happened
Autor: Miroslaw Bawulski
19:55 2025-04-04 UTC+2
41
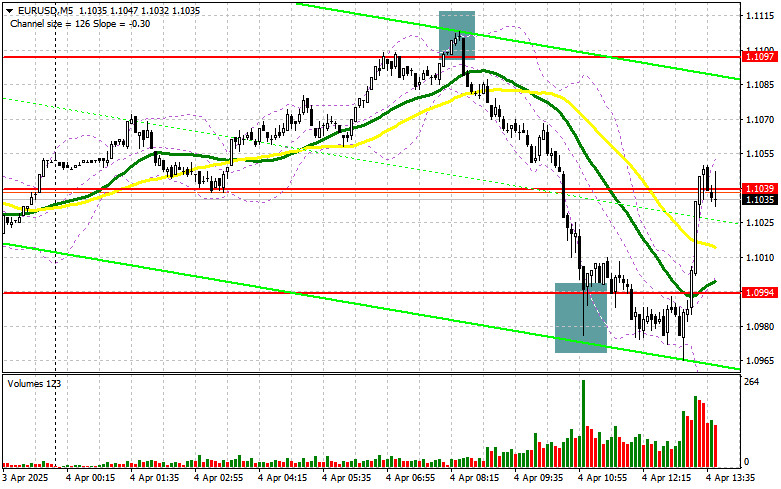
In my morning forecast, I highlighted the 1.0994 level and planned to base my market entry decisions on it. Let's look at the 5-minute chart and break down what happenedAutor: Miroslaw Bawulski
19:52 2025-04-04 UTC+2
42
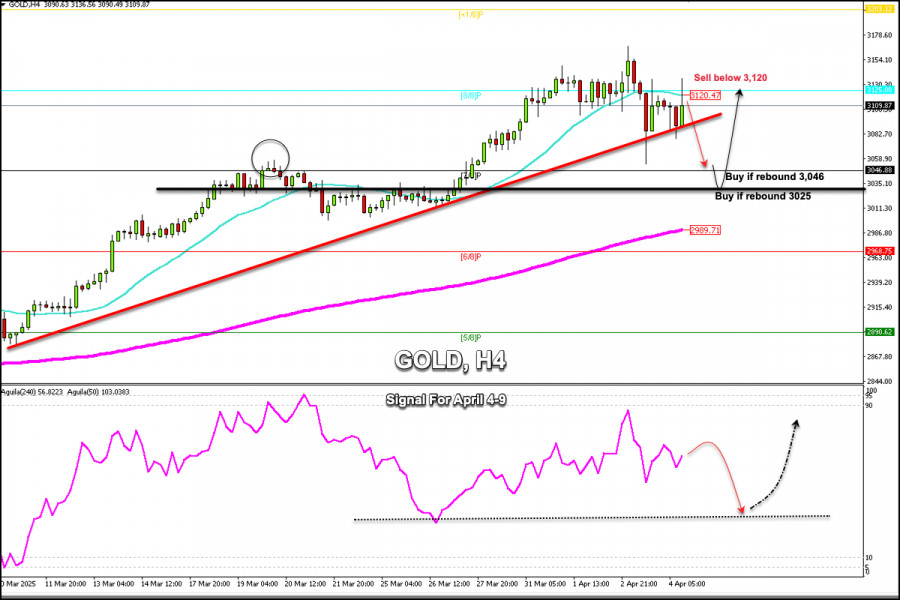
Technical analysisTrading Signals for GOLD (XAU/USD) for April 4-7, 2025: sell below $3,120 or buy above $3,025 (21 SMA - rebound)
If the gold price breaks the uptrend channel again and consolidates below 3,090 in the coming hours, we could expect it to continue falling, and the price could reach 3,070Autor: Dimitrios Zappas
17:37 2025-04-04 UTC+2
51
- Useful links: My other articles are available in this section InstaForex course for beginners Popular Analytics Open trading account Important: The begginers in forex trading need to be very careful
Autor: Sebastian Seliga
14:17 2025-04-04 UTC+2
34
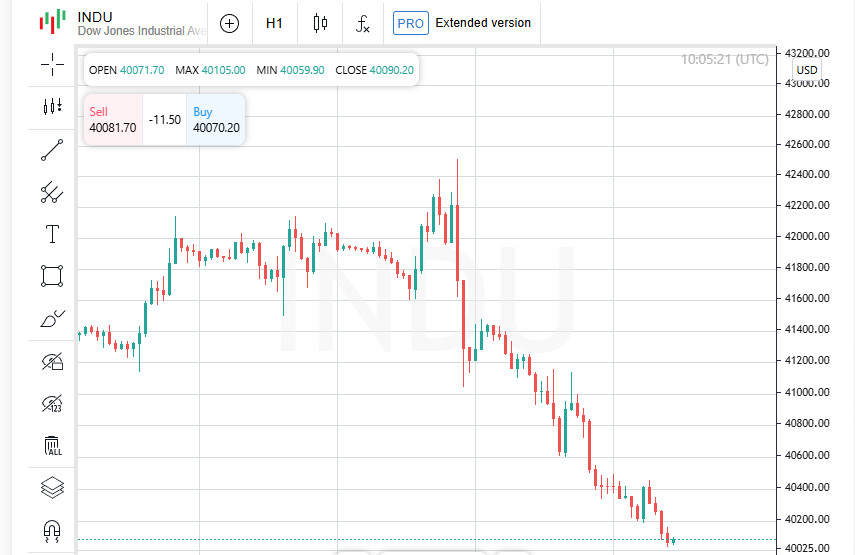
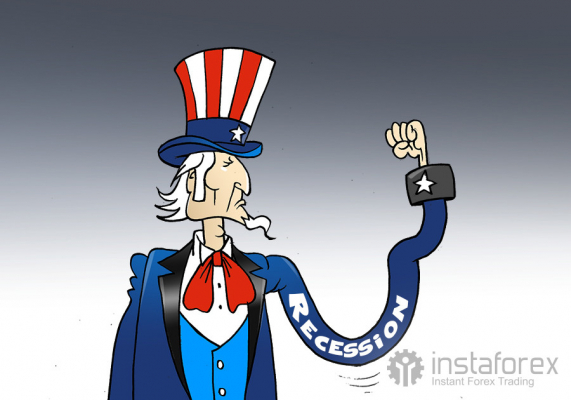
US stock markets crashed on Thursday, posting their most painful daily losses in years, as Donald Trump's unexpected and aggressive tariff maneuver unleashed a wave of panic on global marketsAutor: Thomas Frank
12:09 2025-04-04 UTC+2
56
Gold is attracting some sellers for the second day in a row, despite the absence of any clear fundamental catalyst for a decline. Most likely, this is due to tradingAutor: Irina Yanina
11:50 2025-04-04 UTC+2
61


