


Naš tim čini više od 7.000.000 trgovaca!
Svakog dana zajedno radimo na unapređenju trgovanja. Ostvarujemo vrhunske rezultate i krećemo se samo napred.
Priznatost od strane miliona trgovaca širom sveta najbolje pokazuje koliko se naš rad ceni! Napravili ste svoj izbor i mi ćemo učiniti sve što je neophodno da zadovoljimo vaša očekivanja!
Zajedno činimo sjajan tim!
InstaSpot. Sa ponosom radi za Vas!


Glumac, šampion UFC turnira i pravi heroj!
Čovek koji je ostvario sebe. Čovek koji hoda uz nas.
Tajna uspeha Taktarova jeste stalno kretanje ka svom cilju.
Otkrijte sve strane svog talenta!
Istražuj, pokušaj, padni - ali se nikad ne zaustavljaj!
InstaSpot. Priča Vašeg uspeha započinje ovde!

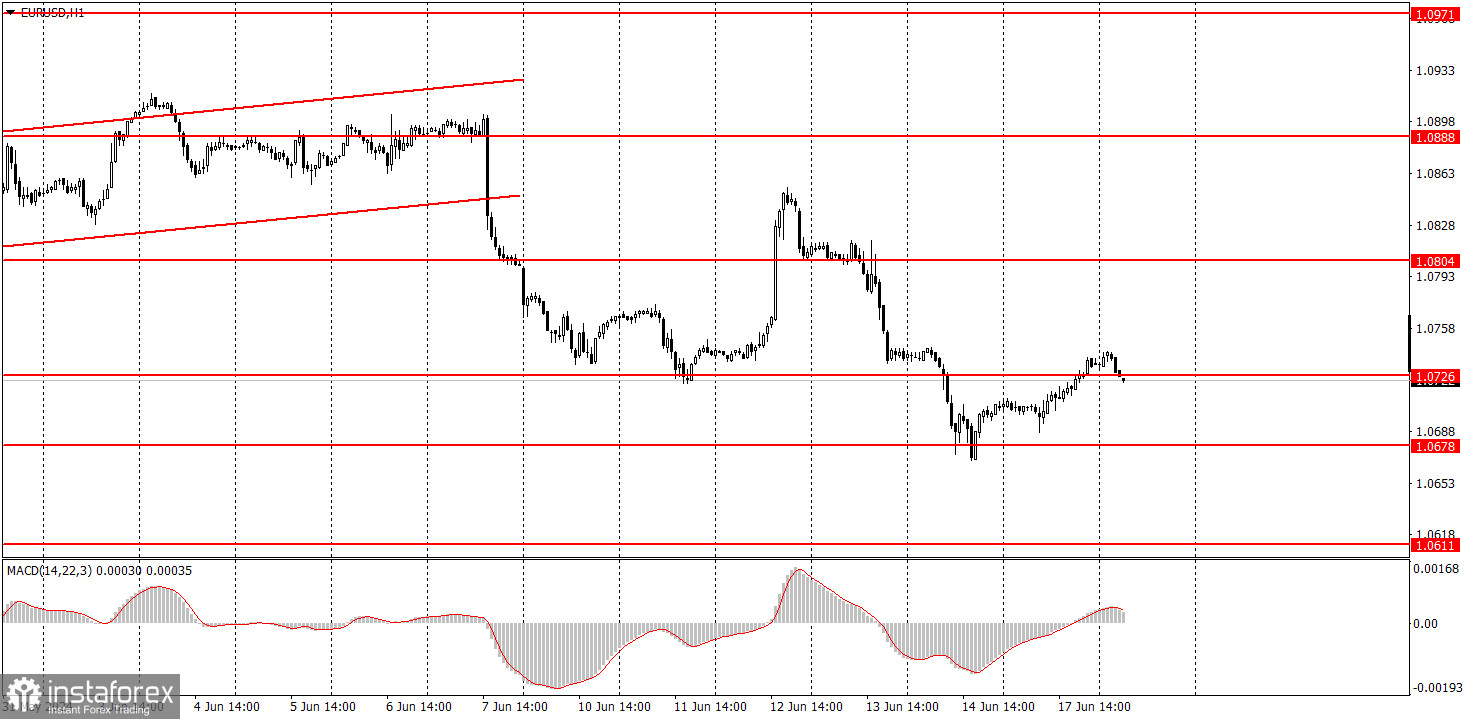
EUR/USD continued to correct higher on Monday, which started last Friday. First, the price rebounded from the level of 1.0678 twice, and second, the price fell for more than two days. Therefore, it was time to start a correction. The downward trend remains intact on almost all the timeframes. On the hourly chart a little over a week ago, it left the ascending channel it had been in for almost two months. Since all the upward movement that we saw during this period was part of a correction (clearly seen on the daily chart), we now expect a strong downward movement.
There are plenty of fundamental reasons for this. We won't list all the factors, but it's enough to understand that the European Central Bank started easing monetary policy much earlier than the market expected. On the other hand, the U.S. central bank had no grounds to lower rates in June, even though the market had anticipated the first Federal Reserve rate cut as early as March. Therefore, the euro has every reason to fall until the Fed finally shows a signal that it is ready to begin monetary easing.
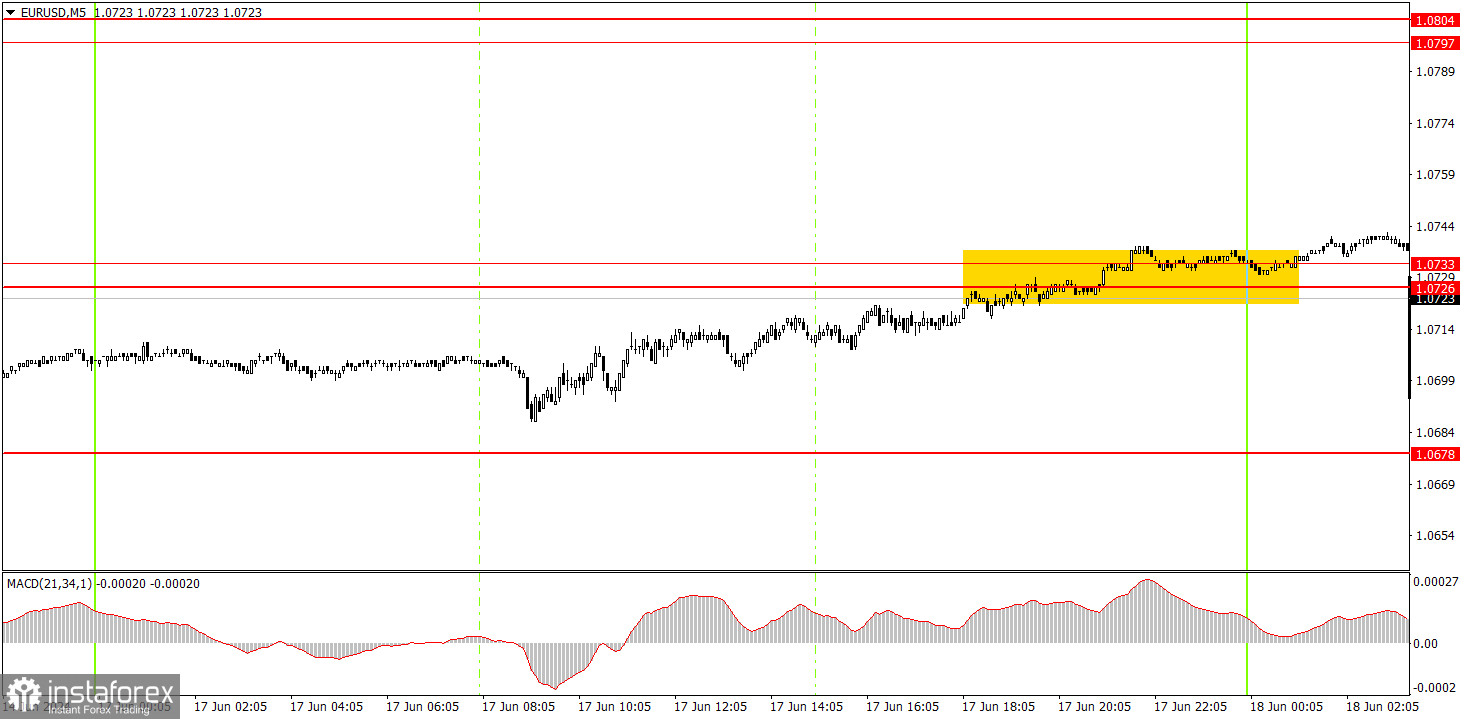
On the 5-minute timeframe, the pair traded with low volatility and it only managed to reach the 1.0726-1.0733 area by the end of the day. During the night, the pair managed to break through this area, so long positions may still be valid today. However, if the price consolidates below this area, short positions will become valid again, as the downtrend persists.
On the hourly chart, EUR/USD has finally started forming a local downward trend. We still expect the pair to drop to levels of 1.0600, 1.0450, and even 1.0200. However, it's important to understand that the price will not reach these targets in just a couple of weeks; they are medium-term. For instance, the pair might freely correct throughout the current week. Nonetheless, we don't see any reasons for the euro to rise.
On Tuesday, traders can expect the pair to correct higher since the price has breached the area of 1.0726-1.0733. However, traders may look to the release of several secondary data, and these reports could also exert pressure on the pair.
The key levels on the 5M chart are 1.0483, 1.0526, 1.0568, 1.0611, 1.0678, 1.0726-1.0733, 1.0797-1.0804, 1.0838-1.0856, 1.0888-1.0896, 1.0940, and 1.0971-1.0981. Today, the second estimate of the Eurozone Consumer Price Index will be published. The market will only react to this report if the actual figure diverges from the first estimate. The U.S. docket will feature reports on industrial production and retail sales, which can also provoke a market reaction.
1) Signal strength is determined by the time taken for its formation (either a bounce or level breach). A shorter formation time indicates a stronger signal.
2) If two or more trades around a certain level are initiated based on false signals, subsequent signals from that level should be disregarded.
3) In a flat market, any currency pair can produce multiple false signals or none at all. In any case, the flat trend is not the best condition for trading.
4) Trading activities are confined between the onset of the European session and mid-way through the U.S. session, after which all open trades should be manually closed.
5) On the 30-minute timeframe, trades based on MACD signals are only advisable amidst substantial volatility and an established trend, confirmed either by a trendline or trend channel.
6) If two levels lie closely together (ranging from 5 to 15 pips apart), they should be considered as a support or resistance zone.
Support and Resistance price levels can serve as targets when buying or selling. You can place Take Profit levels near them.
Red lines represent channels or trend lines, depicting the current market trend and indicating the preferable trading direction.
The MACD(14,22,3) indicator, encompassing both the histogram and signal line, acts as an auxiliary tool and can also be used as a signal source.
Significant speeches and reports (always noted in the news calendar) can profoundly influence the price dynamics. Hence, trading during their release calls for heightened caution. It may be reasonable to exit the market to prevent abrupt price reversals against the prevailing trend.
Beginners should always remember that not every trade will yield profit. Establishing a clear strategy coupled with sound money management is the cornerstone of sustained trading success.
*Analiza tržišta koja se ovde nalazi namenjena je boljem razumevanju tržišta i ne pruža instrukcije za vršenje trgovanja.
Uz InstaSpot-ove analitičke preglede uvek ćete biti u toku sa tržišnim trendovima! Klijentima InstaSpot-a su dostupni mnogobrojni besplatni servisi za uspešno trgovanje.


