Aktuelni obrasci

Obrasci su grafički modeli koje cene formiraju na grafikonu. Prema jednom od postulata tehničke analize, istorija (kretanja cene) se ponavlja. To znači da su kretanja cene često slična u istim situacijama što omogućava predviđanje daljeg kretanja u situacijama sa velikom verovatnoćom.
InstaSpot-ovi važni obrasci su servis lak za korišćenje koji omogućava da budete u toku sa najnovijim promenama na tržištu i da blagovremeno reagujete na signalne znake sa tržišta. U našem servisu uvek možete pronaći najnovije i najvažnije obrasce svakog valutnog para i sa bilo kojim vremenskim okvirom.
Bullish Symmetrical Triangle
was formed on 19.03 at 18:02:02 (UTC+0)
signal strength 3 of 5
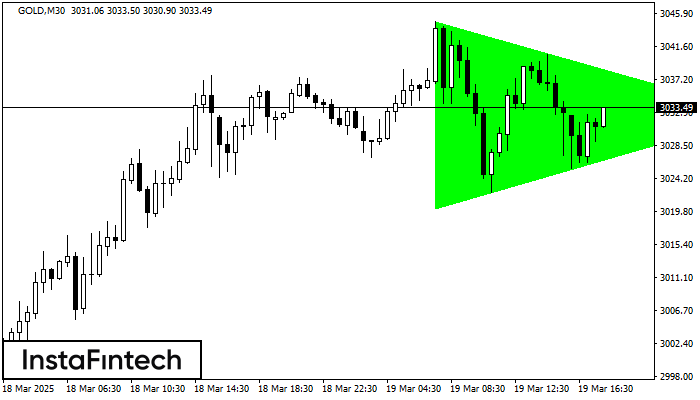
According to the chart of M30, GOLD formed the Bullish Symmetrical Triangle pattern, which signals the trend will continue. Description. The upper border of the pattern touches the coordinates 3044.87/3032.56 whereas the lower border goes across 3020.18/3032.56. The pattern width is measured on the chart at 2469 pips. If the Bullish Symmetrical Triangle pattern is in progress during the upward trend, this indicates the current trend will go on. In case 3032.56 is broken, the price could continue its move toward 3032.86.
Vidi takođe
- All
- All
- Bullish Rectangle
- Bullish Symmetrical Triangle
- Bullish Symmetrical Triangle
- Double Bottom
- Double Top
- Double Top
- Triple Top
- Triple Top
- Triple Top
- Triple Top
- All
- All
- Buy
- Sale
- All
- 1
- 2
- 3
- 4
- 5
Banderín alcista
was formed on 13.04 at 11:56:52 (UTC+0)
signal strength 1 of 5

La señal Banderín alcista – Instrumento de negociación #Bitcoin M5, patrón de continuación. Pronóstico: es posible establecer una posición de compra por encima del alza del patrón de 84963.00
Los marcos de tiempo M5 y M15 pueden tener más puntos de entrada falsos.
Open chart in a new window
Rectángulo Alcista
was formed on 11.04 at 22:20:31 (UTC+0)
signal strength 1 of 5

Según el gráfico de M5, NZDCHF formó el Rectángulo Alcista. El patrón indica la continuación de una tendencia. El límite superior es 0.4754, el límite inferior es 0.4746. La señal
Los marcos de tiempo M5 y M15 pueden tener más puntos de entrada falsos.
Open chart in a new window
Rectángulo Bajista
was formed on 11.04 at 22:10:27 (UTC+0)
signal strength 1 of 5

Según el gráfico de M5, USDCAD formó el Rectángulo Bajista que es un patrón de la continuación de una tendencia. El patrón está contenido dentro de los siguientes límites: límite
Los marcos de tiempo M5 y M15 pueden tener más puntos de entrada falsos.
Open chart in a new window