Aktuelni obrasci

Obrasci su grafički modeli koje cene formiraju na grafikonu. Prema jednom od postulata tehničke analize, istorija (kretanja cene) se ponavlja. To znači da su kretanja cene često slična u istim situacijama što omogućava predviđanje daljeg kretanja u situacijama sa velikom verovatnoćom.
InstaSpot-ovi važni obrasci su servis lak za korišćenje koji omogućava da budete u toku sa najnovijim promenama na tržištu i da blagovremeno reagujete na signalne znake sa tržišta. U našem servisu uvek možete pronaći najnovije i najvažnije obrasce svakog valutnog para i sa bilo kojim vremenskim okvirom.
Bullish Symmetrical Triangle
was formed on 27.03 at 23:09:03 (UTC+0)
signal strength 3 of 5

According to the chart of M30, AUDCHF formed the Bullish Symmetrical Triangle pattern, which signals the trend will continue. Description. The upper border of the pattern touches the coordinates 0.5593/0.5568 whereas the lower border goes across 0.5548/0.5568. The pattern width is measured on the chart at 45 pips. If the Bullish Symmetrical Triangle pattern is in progress during the upward trend, this indicates the current trend will go on. In case 0.5568 is broken, the price could continue its move toward 0.5598.
- All
- All
- Bullish Rectangle
- Bullish Symmetrical Triangle
- Bullish Symmetrical Triangle
- Double Bottom
- Double Top
- Double Top
- Triple Top
- Triple Top
- Triple Top
- Triple Top
- All
- All
- Buy
- Sale
- All
- 1
- 2
- 3
- 4
- 5
Двойная вершина
сформирован 21.04 в 09:05:14 (UTC+0)
сила сигнала 1 из 5
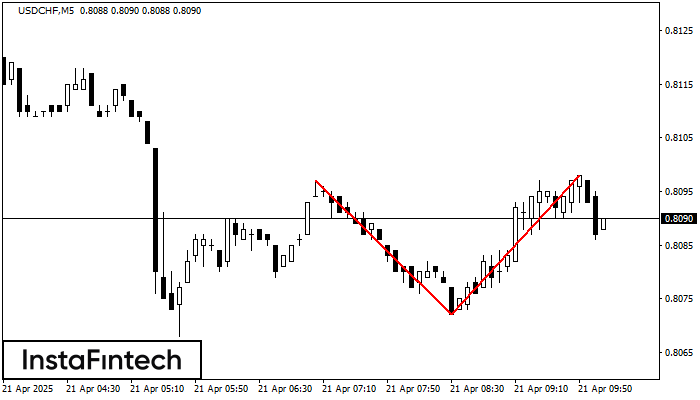
На торговом графике USDCHF M5 сформировалась разворотная фигура «Двойная вершина». Характеристика: Верхняя граница 0.8098; Нижняя граница 0.8072; Ширина фигуры 26 пунктов. Сигнал: Пробой нижней границы 0.8072 приведет к дальнейшему нисходящему
Таймфреймы М5 и М15 могут иметь больше ложных точек входа.
Открыть график инструмента в новом окне
Прямоугольник
сформирован 21.04 в 09:02:17 (UTC+0)
сила сигнала 1 из 5
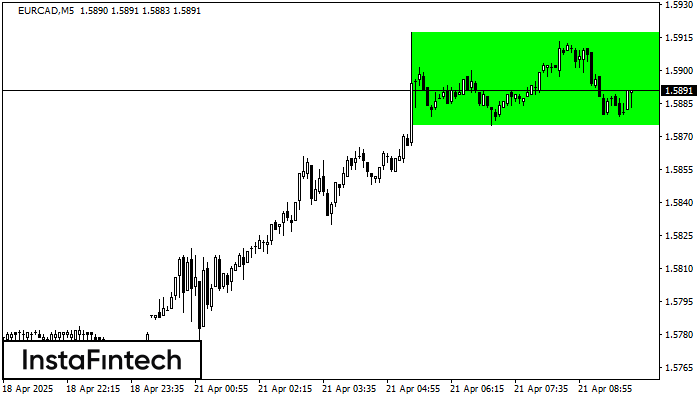
По торговому инструменту EURCAD на M5 сформировалась фигура продолжения тренда - «Прямоугольник». Фигура имеет границы: Нижняя 1.5875; Верхняя 1.5917. В случае пробоя верхней границы вероятно дальнейшее движение в сторону тренда
Таймфреймы М5 и М15 могут иметь больше ложных точек входа.
Открыть график инструмента в новом окне
Бычий симметричный треугольник
сформирован 21.04 в 08:56:47 (UTC+0)
сила сигнала 1 из 5
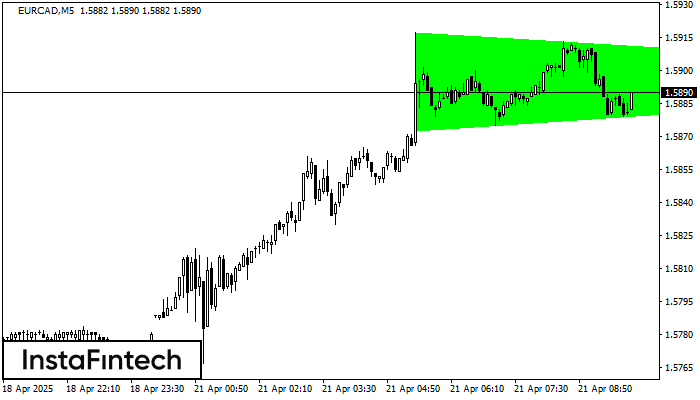
По EURCAD на M5 фигура «Бычий симметричный треугольник». Характеристика: Фигура продолжения тренда; Координаты границ – верхняя 1.5917, нижняя 1.5872. Проекция ширины фигуры 45 пунктов. Прогноз: В случае пробоя верхней границы
Таймфреймы М5 и М15 могут иметь больше ложных точек входа.
Открыть график инструмента в новом окне