Aktuelni obrasci

Obrasci su grafički modeli koje cene formiraju na grafikonu. Prema jednom od postulata tehničke analize, istorija (kretanja cene) se ponavlja. To znači da su kretanja cene često slična u istim situacijama što omogućava predviđanje daljeg kretanja u situacijama sa velikom verovatnoćom.
InstaSpot-ovi važni obrasci su servis lak za korišćenje koji omogućava da budete u toku sa najnovijim promenama na tržištu i da blagovremeno reagujete na signalne znake sa tržišta. U našem servisu uvek možete pronaći najnovije i najvažnije obrasce svakog valutnog para i sa bilo kojim vremenskim okvirom.
Double Bottom
was formed on 31.03 at 13:30:19 (UTC+0)
signal strength 3 of 5
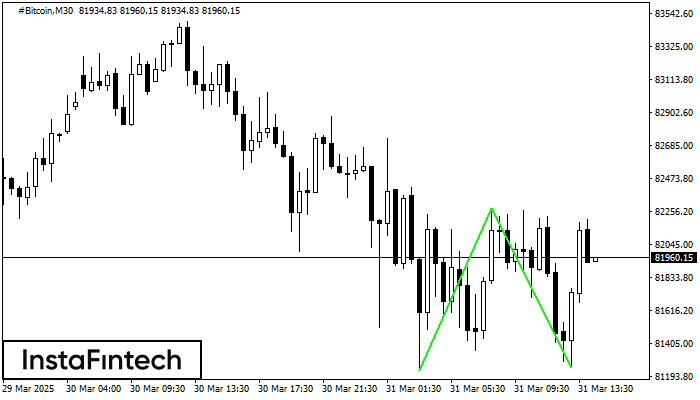
The Double Bottom pattern has been formed on #Bitcoin M30. This formation signals a reversal of the trend from downwards to upwards. The signal is that a buy trade should be opened after the upper boundary of the pattern 82275.64 is broken. The further movements will rely on the width of the current pattern 104454 points.
Vidi takođe
- All
- All
- Bullish Rectangle
- Bullish Symmetrical Triangle
- Bullish Symmetrical Triangle
- Double Bottom
- Double Top
- Double Top
- Triple Top
- Triple Top
- Triple Top
- Triple Top
- All
- All
- Buy
- Sale
- All
- 1
- 2
- 3
- 4
- 5
Bullisches Rechteck
was formed on 21.04 at 06:10:19 (UTC+0)
signal strength 1 of 5

Auf dem Chart M5 bildete #Bitcoin das «Bullisches Rechteck» Muster. Dies ist das Muster einer Trendfortsetzung. Die untere Grenze des Musters liegt bei 87098.24; die obere bei 87617.56. Bei einem
Die М5 und М15 Timeframes können mehrere falsche Einstiegspunkte haben.
Open chart in a new window
Doppel-Boden
was formed on 21.04 at 06:05:07 (UTC+0)
signal strength 1 of 5

Auf dem Chart M5 bildete USDJPY das «Doppel-Boden» Muster. Diese Formation signalisiert eine Trendwende von unten nach oben. Signal: eine Kaufposition sollte nach dem Durchbruch der oberen Grenze des Musters
Die М5 und М15 Timeframes können mehrere falsche Einstiegspunkte haben.
Open chart in a new window
Doppel-Top
was formed on 21.04 at 05:59:59 (UTC+0)
signal strength 1 of 5
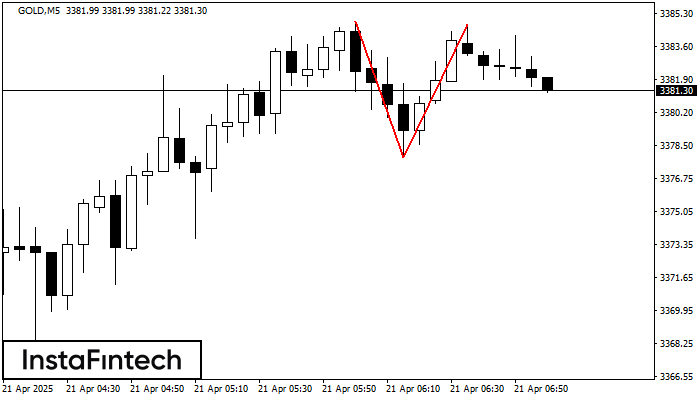
Auf dem Chart M5 bildete GOLD das «Doppel-Top» Muster. Beschreibung: die obere Grenze 3384.89; die untere Grenze3377.85; die Breite des Musters beträgt 687 Punkte. Sell-Position sind besser unter der unteren
Die М5 und М15 Timeframes können mehrere falsche Einstiegspunkte haben.
Open chart in a new window